The Patent Enforcement Iceberg
We know quite a bit about patent litigation. Thanks to a great deal of academic research, to companies like Lex Machina, and to projects that categorize patent plaintiffs, we can tell exactly how many patent suits are filed every year, against how many defendants, who files them, how many other suits they file, where they file them, whether they go to judgment, and who wins.
But how often do companies and individuals assert patents outside of litigation? No one knows for sure. The problem is that licensing negotiations and license deals that don’t result in litigation are almost invariably kept secret. The result is that patent litigation is like the proverbial tip of the iceberg—the observable piece sticking out of the water, but probably not all or even most of what there is. Various people have speculated that unlitigated (and therefore unobserved) assertions are a majority and probably as much as 90% of all patent enforcement. That is a real problem for those who make patent policy and for scholars and businesspeople who want to assess the true cost of patent enforcement.
We wanted to know how often companies were approached to take patent licenses without a lawsuit being filed. So we asked them. Using a simple survey, we got data from dozens of companies about how often they were sued, how often they were approached to take a license without being sued, and the characteristics of those licensing proposals. The result is the first real look at what goes on beneath the surface of patent enforcement.
We found that while patent litigation does not reflect everything that is going on, there was less unlitigated—and therefore unseen—patent enforcement than some of us had thought. Roughly one-third of all patent licensing efforts among our survey respondents end in litigation—significantly more than the 10% some had predicted. And, for most respondents, about one-half of the demands end in litigation. Our results allow us to get a handle on the actual size of the patent enforcement business and to try to estimate the total cost of responding to enforcement efforts. We offer some ballpark estimates of the cost of responding to patent assertions in Part III.
Our survey respondents are a significant segment of the economy, but they are far from all of it. And they differ in certain ways from companies as a whole. We hope to be able to expand the universe of respondents in a later round of surveys. In Part I we explain what we did. In Part II we explain what we found. And in Part III we consider some implications for business and public policy if we extrapolate our limited results to the broader economy.
I. Finding Hidden Enforcement Efforts
Scholars have long lamented the absence of information about patent assertions and enforcement that can’t be observed because it doesn’t lead to litigation.[1] In the absence of evidence, it is reasonable to assume that many, if not most, disputes don’t result in litigation. We and others expected that, just as the overwhelming majority of patent lawsuits settle rather than go to judgment,[2] the overwhelming majority of patent license demands would be resolved without litigation.[3] Litigation is expensive and uncertain, which is why, even when it is filed, most parties settle the case rather than see it through.[4] The same should logically be true of patent demands outside of litigation. Resolving those disputes without going to court is cheaper and quicker. It is also private, something that can benefit both sides.
But no one knows for sure. The problem is the very privacy of those prelitigation resolutions. Because those deals are almost invariably confidential,[5] not only the terms but the very existence and extent of such a patent enforcement market is open to question.[6] Scholars, policymakers, and businesspeople have speculated about the extent of enforcement without litigation, with most assuming such demands outnumber lawsuits and some assuming that they do so by an order of magnitude.[7] Patent litigation, on this story, is the tip of the proverbial iceberg, with perhaps 90% hidden under the surface.[8]
In this Essay, we offer evidence to test that assumption. We cannot observe nonlitigation patent assertions systematically. No one can. Instead, we surveyed companies to ask them how many assertions they received and how many of those assertions ended up involving litigation. We defined patent assertions to include negotiations primarily over a license for use of one or more patents in an existing product. Our goal was to include negotiations over patent licensing that did not rise to the formal level of threat letters with claim charts, but not to include core business deals that also involved patents as a subsidiary issue. We did not include proactive transactions in which the buyer/licensee affirmatively seeks out patents to buy or license; our focus was on patent owners approaching licensees.[9]
We also asked a couple of questions designed to assess who was asserting the patents. Specifically, we asked whether the assertions came from practicing entities or non-practicing entities (NPEs)—largely patent assertion entities (aka “patent trolls”), but also including universities, individual inventors, and others that don’t make or sell products or services. We asked how many patents were asserted. And as a proxy for how serious the assertion was, we asked whether the patent owner provided claim charts at any point in the negotiation process.[10]
Previous efforts to get companies to talk about their nonlitigation patent negotiations have foundered on confidentiality. To avoid that problem, we did several things. First, we committed not to identify the respondents. In the data that follows, we deliberately group companies by revenue and by broad technology category so that it is harder to identify any one company.[11] Second, in order to avoid inducing people to violate confidential settlements, we asked no questions about the outcomes of the assertions. For example, we did not ask companies to tell us how much they paid to license a patent, if anything, or indeed whether they licensed the patent at all. We were simply interested in the number and nature of the assertions they received. Finally, we did not ask them to identify any particular patent owner. Instead, we asked them only about the aggregate number of assertions they received in one fiscal year—2015. And we asked them not for an exact number, which might be used to identify them, but only to class the number in one of several brackets.
We kept the survey short to increase the chance that busy in-house counsel would respond. The full survey is reprinted in Appendix A. We approached sixty-eight companies by email about participating in the survey. Of those, thirty, or 44.1%, responded with completed surveys. Particularly given the sensitive nature of the questions and the confidentiality of most of the subject matter, that is a very high response rate.[12] We contacted companies we knew had intellectual property (IP) counsel. This wasn’t a randomly selected group; we had prior contacts with many of the companies. We reached out to those contacts because they were more likely to respond to someone they knew.[13] The companies that responded cover a range of different sizes and industries, though they—like the ones we asked—are concentrated in the information technology (IT) industries broadly defined because that is where patent assertion has been the most significant issue.[14] And they tend to be large companies with in-house IP counsel.[15]
This is not a comprehensive look at all patent enforcement outside of court. We doubt such a thing will ever be possible, though we hope to expand our survey in the future to more companies and a broader range of industries. Rather, to continue the iceberg analogy, what we present is a series of core samples, drilling down into particular parts of the iceberg to see how deep beneath the surface it goes. Different companies, like cores sampled from different places, might well tell a somewhat different story. But by surveying companies with a range of sizes and across many industry sectors, we can present a better picture of what goes on outside the courtroom than anyone has been able to do so far. This is an ongoing process, and we hope to gather more companies and further information soon.
II. The Ice Is Thin
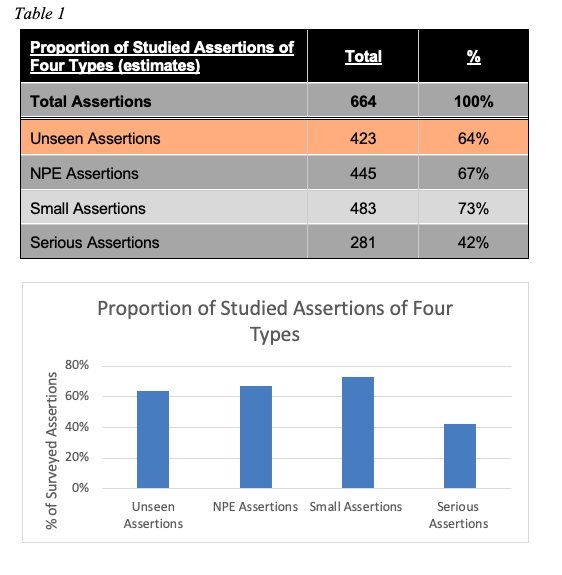
The thirty companies we surveyed reported receiving a total of 593 patent assertions in fiscal year 2015.[16] We report the summary details of those assertions in Table 1. Each type is a portion of the total assertions identified and is treated separately from every other type. For example, of the 593 total assertions, there were 413 unlitigated assertions and 386 NPE assertions. To keep the survey simple, we did not ask about subcategories, so we don’t know, for instance, what percentage of NPE assertions were also unlitigated.
Table 1: Assertion by Type[17]
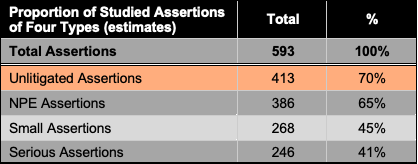
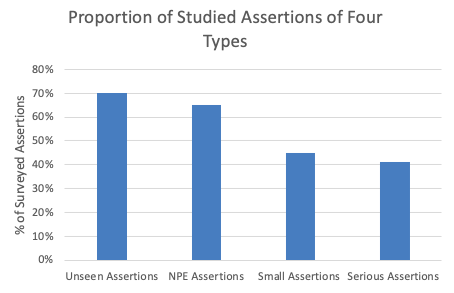
Figure 1: Assertions by Type
A. Unlitigated Assertions
Of those 593 assertions, the respondents reported that 413, or 70%, were resolved without a lawsuit being filed, while 180 resulted in litigation. Although 70% may appear high, it actually strikes us as surprisingly low. While there is certainly patent enforcement going on outside of court, a surprisingly high percentage of assertions do ultimately end up in court. There is less hidden patent enforcement out there than people have suggested.[18]
To validate this result against the risk of reporting bias, we searched each of the companies on Lex Machina to see how many lawsuits were initiated against them. In calendar year 2015, there were 158 such suits. That number is modestly lower than our estimate of the self-reported number, but it is certainly within the range. The differences likely stem from three factors. First, we asked respondents to detail how many assertions they received in the most recent fiscal year. Because different companies have different fiscal years, we couldn’t replicate that exactly in our Lex Machina search. Instead we used calendar year 2015. There are presumably modest differences between the number of suits in the calendar and fiscal years. Second, our survey did not ask about the exact number of assertions, but it put the results in buckets. That, too, means we should expect some divergence between the actual and reported litigation numbers.[19] Third, Lex Machina reports only U.S., not international, litigation. Our survey was worldwide. Most companies we surveyed would be unlikely to face suits abroad that did not have U.S. counterpart suits, but some might.[20]
B. Patent Assertions by Entity Type
We also got insight into the characteristics of the threat letters companies received. Our survey revealed that 386 of the 593 assertions (65%) reported were made by NPEs.[21] That is consistent with previously reported data from litigation.[22] Because we don’t have a representative sample of companies and our respondents are concentrated in industries like IT and consumer products where NPE suits are more common, we can’t draw any firm conclusions about the overall percentage of NPE assertions in the economy. But the high percentage of NPE assertions, particularly given our definition of NPE, may affect the size of the iceberg. Our study was not aimed at finding pure business negotiations that happen to involve patents. Our focus on patent enforcement efforts—even informal efforts to license—may skew the results toward NPEs. And that in turn might affect the percentage of unlitigated assertions. Business negotiations over real technology transfer are presumably less likely to go to litigation even if those negotiations involve patents in part.[23] And NPE assertions may be more likely to begin with a lawsuit, particularly given the rise of forum shopping by patent plaintiffs.[24] Since the Supreme Court relaxed the standards for filing a declaratory judgment action in 2007,[25] patent owners may be more likely than in the past to file first and negotiate later rather than lose the advantage of forum choice. That is particularly likely for NPEs, which have overwhelmingly filed suit in the Eastern District of Texas.[26]
C. The Nature and Seriousness of Patent Assertions
We also asked some questions designed to get at how significant the patent assertions were. Some companies send dozens or hundreds of letters with little follow-up, while other companies take their patent enforcement efforts much more seriously.[27] Many recipients tend to ignore the first letter they receive, knowing that some percentage of patent asserters will simply go away.[28] The size and seriousness of the assertions naturally affect the cost of responding to them, and these factors may help us to get a handle on how much money companies spend dealing with patent assertions.
First, we asked how many patents were asserted in the enforcement efforts. Large, multipatent assertions are almost certainly more expensive to deal with and may be more likely to go to litigation. Our respondents indicated that 268 of the assertions, or 45%, involved five or fewer patents. That means a majority are large-scale patent assertions.
Second, as a proxy for the seriousness of the assertion, we asked how many assertions involved the plaintiff providing a claim chart (before a court required it, at least). Patentees who have actually taken the time to map particular claims to the target’s product are much less likely to simply go away, and they might be less likely to have overread their claims in order to assert them against everyone. We found that a significant minority of assertions (246, or 41%) actually included a claim chart mapping at least one claim to the target’s products.
D. Size Matters
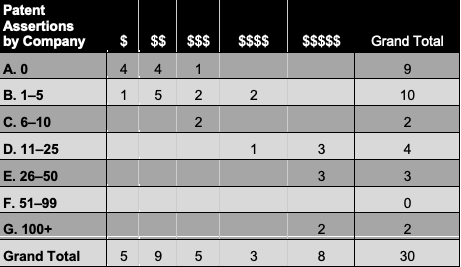
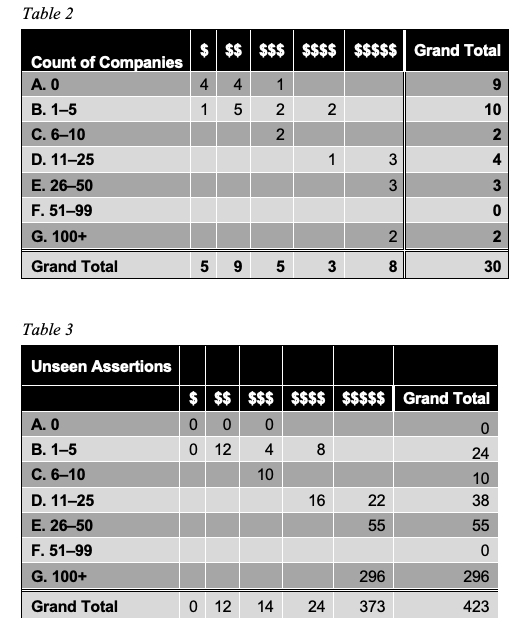
Finally, we mapped the number of assertions against the size of the responding companies. Consistent with received wisdom and prior work,[29] we find that the bigger you are the more you get threatened. We report the results by company in Table 2.
Table 2: Assertions Against Companies by Size of Company[30]
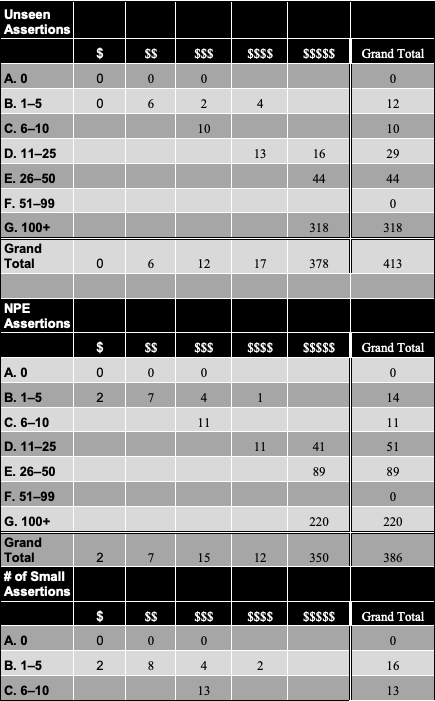
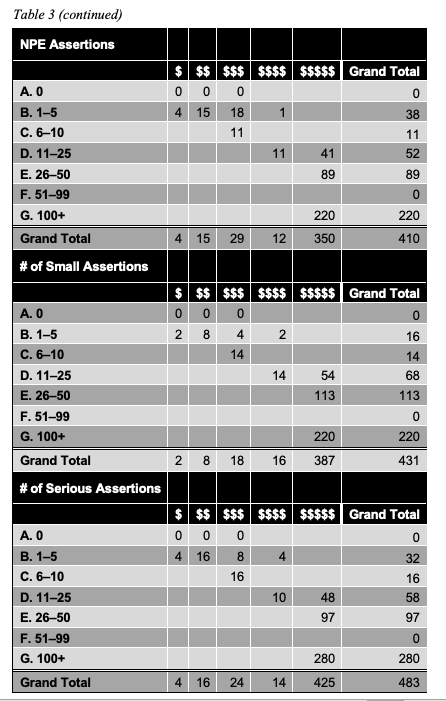
The same pattern continues when we break down the types of assertions. We present those results in Table 3. There does not seem to be an obvious difference between seen and unlitigated assertions, NPE and practicing-entity assertions, large and small assertions, and serious and casual assertions. Each type of assertion is more likely as the company’s revenue increases.The largest companies in our survey got more patent demands; the smallest companies got the fewest patent demands. The relationship isn’t perfect, but it’s pretty strong.
Table 3: Types of Assertions by Revenue
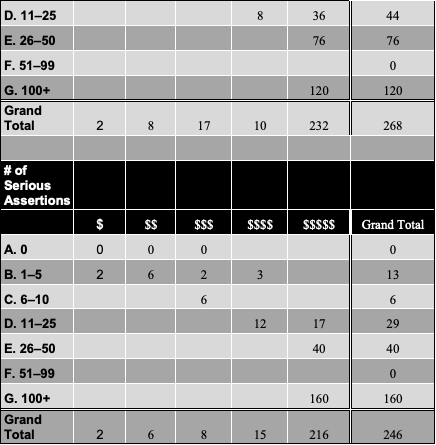
One thing does stand out: The two largest companies in our survey received more than two-thirds of all the patent assertions reported. In part, that is a function of their size: we found that the more money you made, the more likely you were to be sued or threatened with suit. But that is not a full explanation. There were six other companies in the largest size range. While they all received more assertions than most other companies, companies three through eight collectively received only 144 assertions compared to the 400 for the top two, and no company other than the top two received more than fifty assertions.This data does provide some indirect evidence that smaller companies are not being flooded with assertions they can’t afford to litigate. While we don’t have that many respondents in the smallest category (and that category itself includes companies up to $100 million in revenue), the ones who did respond had very few enforcement requests. That may help allay the fears of some that startups are being targeted by patent owners.[31] But we emphasize that we don’t have a broad enough set of results to draw firm conclusions on that point.
Industry category may also matter. All of the largest companies were in the technology industry. There is reason to think that intensity of patent assertions is concentrated in certain market sectors, including IT, and more specifically, computers and the internet.
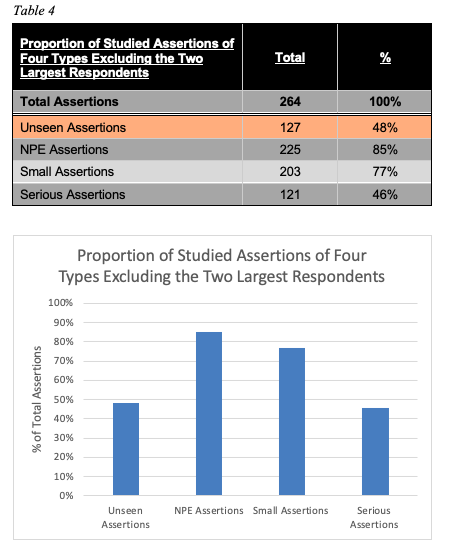
The fact that assertions are so heavily skewed towards a few very large companies in the IT space means that our survey results might give a misleading picture of what things are like in the rest of the world. We are not persuaded that is true. The fact that large companies in the IT industry attract hundreds of patent assertions is a fact of the modern world and certainly bears on the costs of the patent system. But it seems worth looking to see how things change if we exclude those companies from consideration. We present the summary results in Table 4.
Table 4: Types of Assertions Excluding the Two Largest Respondents
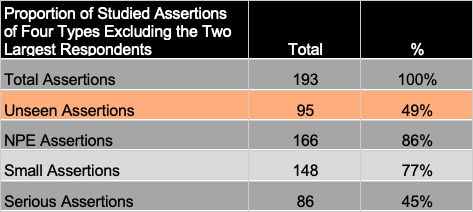
Figure 2: Proportion of Types of Assertions Excluding the Two Largest Respondents
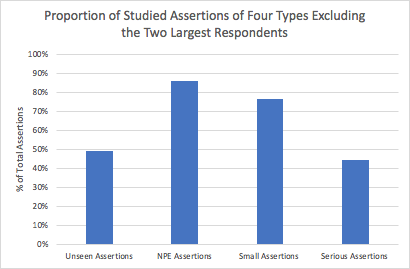
As Table 4 shows, things do look different without the two largest players, though not necessarily in the way one might expect. The percentage of unlitigated assertions drops even further, to less than half of all assertions. So, the unseen part of the iceberg is even less significant than it was in the overall study. The share of NPE assertions rises significantly, to 86%, once the top companies are excluded. So too does the share of small assertions. Again, we caution that this does not mean that 86% of all patent assertions in the economy come from NPEs; our survey respondents still tend towards the computer and telecommunications industries. Most of those NPE assertions (130 of the 166) were against the companies remaining in the study with the largest revenue. In these industries, 86% may be a more accurate estimate of the share of assertions brought by NPEs.
III. Implications
In this Part, we consider some descriptive and policy implications of our data if we extrapolate it to the industry at large, or at least to the IT industry. Before we do that, we want to repeat a note of caution: this is not a survey of every company in the country, and it is not a representative sample of those companies. The companies we talked to tend to be larger than average, and they are clustered in the IT industries. That may affect how easily we can generalize our results. So take what follows with an appropriate dose of salt. If you are in a different industry, your mileage may vary. Indeed, in certain industries, like pharmaceuticals, it almost certainly does vary.[32]
Based on our results, patent enforcement is mostly happening in court rather than in conference rooms to a surprising extent. There is no large, unseen body of patent assertion that is resolved without going to court. Those cases exist, but they are perhaps half or maybe two-thirds of all assertions—less than some previously assumed.[33] This suggests that, while there may be a robust market for technology and technology transfer,[34] there is a much less significant market for patent licensing per se.[35]
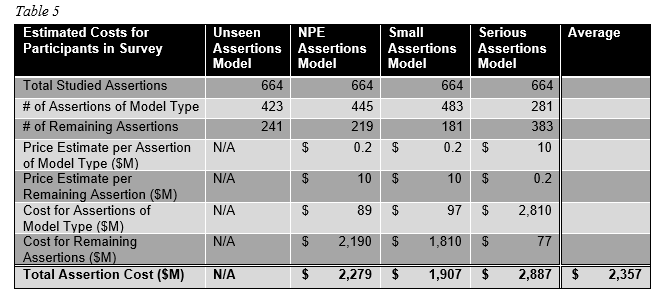
We can also use our data to try to get a handle on the total costs of patent enforcement to companies on the receiving end of those suits. We take three different approaches for estimating those costs. First, we distinguish between NPE and non-NPE assertions. We assume that competitor assertions, both with and without litigation, cost more money to resolve. We assume that NPE assertions take an average of $200,000 to resolve (including attorney’s fees, license fees, and management costs), while competitor assertions take an average of $10 million to resolve (including the ultimate payment, not just the costs of litigation). One can question both of those numbers, of course. Many NPE assertions are more expensive, but the combination of low settlement prices even for those that go to court[36] and the fact that many non-litigated NPE assertions simply go away with no payment makes that number defensible.[37] On the other hand, while competitor suits and negotiations will often resolve for less than $10 million, some cases will result in a significant license fee that will skew the average upwards, and litigating competitor cases through trial is expensive even if nothing is ultimately paid to the plaintiff.[38]
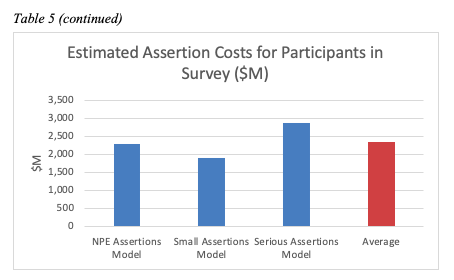
We made similar assumptions regarding the size of the assertion and how serious the assertion is. We treat large multipatent assertions (in court or out) as requiring more attention and as more likely to lead to a payout. Similarly, we treat serious assertions (those for which plaintiff’s attorneys have investigated the defendant’s product and prepared a claim chart before sending a letter) as likely to involve more attorney resources and as more likely to involve an eventual payment. Again, one can quibble with the numbers in both directions.[39] We present the basic data in Table 5, so you can see how the estimates change with the assumptions. Figure 3 depicts the total-cost estimates for our survey participants using different-variable estimates.
Table 5: Estimated Costs for Participants in Survey
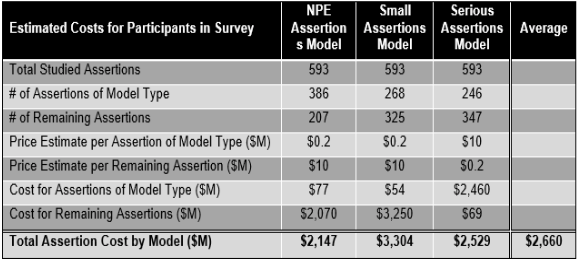
Figure 3: Estimated Assertion Costs for Participants in Survey

One thing that is notable about our three different estimates is how close they are to each other.[40] The cost to the thirty companies surveyed of patent assertions in 2015 was between $2.1 billion and $3.3 billion. That includes any payment to patent asserters (presumably a wealth transfer, not a social cost, and possibly a social benefit if it encourages research and development), but it does not include the plaintiff’s enforcement costs or the costs to the legal system. Nor does it include disruption costs to third parties such as customers. And it does not include other patent-related costs, such as joining defensive patent associations or buying up portfolios of patents to keep them from being asserted.
If we assume that these companies are somewhat representative (and see our caution above), we can also use this data to make a ballpark estimate of the total cost of patent assertions in 2015. As noted above, the survey respondents were the subject of 158 patent lawsuits in the United States in 2015 per Lex Machina, and there were 5,824 patent lawsuits in the country during that year. Our survey respondents represented 2.7% of all patent lawsuits. If we assume that nonresponding companies had the same ratio of seen to unlitigated assertions and similar ratios of small and serious assertions, that would put the total cost of the patent system to assertion recipients in 2015 at between $77.7 billion and $122.2 billion.[41]
We can’t know, of course, whether the pattern of assertions against nonresponding companies is the same as it is for our survey participants. The fact that our survey respondents had a surprisingly low rate of unlitigated assertions suggests that these estimates might be a lower bound on the total costs. So too does the likely fact that our respondents had a higher rate of small and NPE assertions, which our model assumes cost less than competitor assertions. But it is possible that the iceberg is even smaller in other industries—a fact that would reduce the total social-cost estimate.
Another possibility is that our numbers overstate the total costs because they are inflated by the inclusion of two companies that received a large number of assertions, and those two companies may not be representative of the economy as a whole. That is certainly true at one level: those companies are unrepresentative. But they are not unique. At a minimum, there are several companies we did not survey that likely have similar characteristics and similar stories to tell. In any event, the important question given our methodology is whether those companies have a much larger share of unlitigated assertions, since our cost estimate is based on the ratio of suits in the survey sample to suits in the total economy.
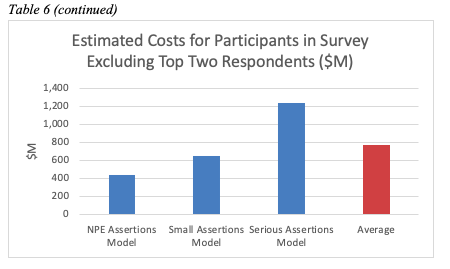
Once we exclude the top two companies, the total cost to the remaining companies in the survey goes down, of course. We present the results in Table 6.

Figure 4: Estimated Cost for Participants in Survey Excluding Top Two Respondents
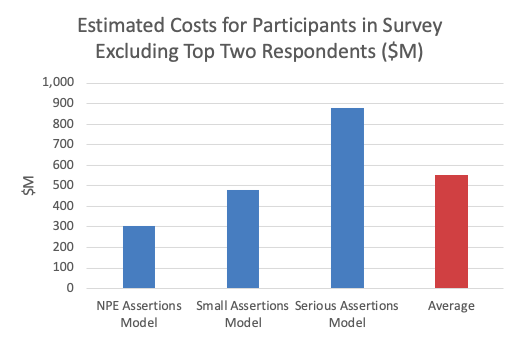
The number of lawsuits, however, goes down as well. The companies remaining in the survey received seventy-four lawsuits per Lex Machina, or 1.3% of the total lawsuits in 2015. Multiplying that by the estimated costs gives somewhat lower national cost estimates, ranging from a low of $23.3 billion to a high of $67.8 billion. Notably, however, those lower cost estimates are based on extrapolation of the higher share of small and NPE assertions and the lower share of unlitigated patents. It may be that the IT industry, excluding the top respondents, is actually less representative of the rest of the patent system than our overall sample is. Certainly, overall reports suggest that NPEs, while a bare majority of patent suits, are significantly less than 86% across all industries.[42]
A more conservative estimate, then, might be to extrapolate our survey only to software and related fields. A recent study of litigation (albeit from a few years before 2015) finds that 34.8% of patent litigation involves software.[43] If we take that number as a rough proxy for 2015 software assertions,[44] the companies in our survey were involved in 7.8% of litigation involving computer technology. That puts the patent-assertion cost estimate for the computer industry as a whole at somewhere between $27.5 billion and $42.4 billion.
There is, then, reason to believe that the presence of some atypical companies is skewing the results, but not necessarily in the way one would think. And the ballpark estimates of the cost of patent enforcement—most plausibly somewhere in the range of $80 billion to $100 billion per year—suggest that patent acquisition and enforcement are significant factors in the economy as a whole—at least in the computer industry.[45] But it is not, contrary to popular belief, mostly hidden. Rather, a surprisingly large percentage of patent assertions happen in court, not in the boardroom.
One final question is whether we should think of $100 billion per year as a large or a small number. It certainly seems large to us mere mortals. And it is significantly larger than Lemley’s estimate of the costs of patent litigation from nearly two decades ago, so we might be more worried about the costs of bad patents than Lemley was then.[46] On the other hand, a cost of $100 billion pales in comparison to the overall size of the United States economy, with a GDP of $18.12 trillion in 2015.[47] And it is an even smaller part of the global economy.[48] Perhaps 0.5% of the U.S. economy is a reasonable, or even small, price to pay for a patent enforcement system.[49]
A more reasonable comparison might be to expenditures on research and development (R&D). The United States spends 2.79% of its GDP on R&D,[50] or $506 billion. But much of that money is public. Private R&D expenditure in the United States in 2015 was $356 billion.[51] So $100 billion represents more than a quarter of total R&D expenditure paid in defending patent assertions. That does seem like a significant diversion of resources, though as we noted above, some of that money is paid from targets to patent owners, and some of those patent owners are themselves inventors or pass some of their revenue on to inventors.[52]
The reader can decide for herself whether that number is too high, too low, or just right as a matter of social policy. It seems to us like an awfully large share of R&D money to be spent on patent assertions divorced from technology transfer.[53] But whatever the number should be, our data provide valuable insight into both what happens beneath the surface of patent assertions and the total cost of those assertions. That data should inform decisions about patent policy.
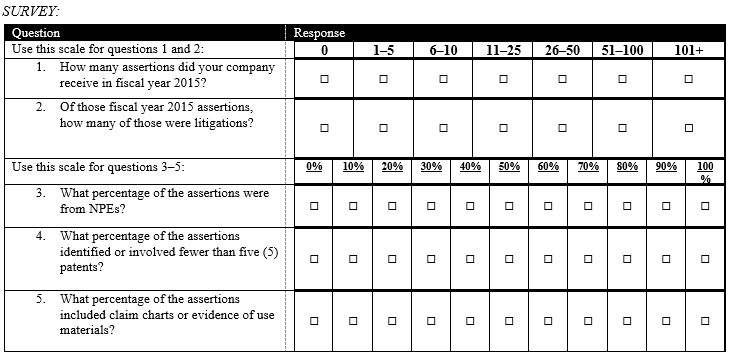
Appendix A: Survey Questionnaire
SURVEY FORM
BACKGROUND: Mark Lemley (Stanford Law School) together with Kent Richardson and Erik Oliver (Richardson Oliver Law Group) are working on a project to gather information about the scale of hidden patent assertions. We believe this will be the first analysis of this topic and the results will be helpful for companies in planning and strategy development. The questions and the report are looking at inbound patent assertions only. We are not asking for outbound activity or how your company may have handled any particular assertion. Participants who respond to this survey will receive a detailed, but anonymized, private report about the results. Additionally, the anonymized aggregate information will be used to prepare a paper.
INSTRUCTIONS AND DEFINITIONS: This survey is designed to take about 5 minutes to complete. When answering the questions please keep in mind these definitions:
Assertion: Includes all forms of patent issues: patent lawsuits initiated, patent licensing negotiations initiated, and letters/emails requesting patent licenses (even if your company does not respond to a particular letter/email).
Non-practicing entity (NPE): Means any entity that generates more than half of its revenue from patent assertion activities. This definition can include operating companies and inventors asserting their own patents depending on the entity’s revenues derived from patent assertions. This definition of NPE does not include universities and research institutes.
[SURVEY table reproduced on next page]
THANKS: Thanks for taking the time to fill out this survey. We plan to privately distribute the anonymized detailed results to participants in late 2016. Anonymized Aggregate information will be published in early 2017.
QUESTIONS: Call or email XXXXX if you have any questions.
Appendix B: Alternative Analysis Using the Midpoint Range Estimate

- .See, e.g., John R. Allison et al., Our Divided Patent System, 82 U. Chi. L. Rev. 1073, 1137 (2015) (noting that the patent assertions that involve litigation represent only the tip of the iceberg); James Bessen & Michael J. Meurer, The Direct Costs from NPE Disputes, 99 Cornell L. Rev. 387, 389 (2014) (noting that information about NPE patent licenses is often unavailable because the terms are typically secret); Robin Feldman, Intellectual Property Wrongs, 18 Stan. J.L. Bus. & Fin. 250, 312–13 (2013) (asking what patent assertion activity looks like aside from litigation); Robin Feldman, Transparency, 19 Va. J.L. & Tech. 271, 275 (2014) (describing the patent system’s problems relating to transparency of ownership); Robin Feldman & W. Nicholson Price II, Patent Trolling: Why Bio & Pharmaceuticals Are at Risk, 17 Stan. Tech. L. Rev. 773, 779 (2014) (“Estimates suggest that 90% of patent demands never proceed to litigation . . . .”); Sara Jeruss et al., The America Invents Act 500: Effects of Patent Monetization Entities on US Litigation, 11 Duke L. & Tech. Rev. 357, 362 (2013) (speculating that the findings from the study are likely to “understate the true impact of patent monetization entities on the patent system” since lawsuits “are only the tip of the iceberg”); Mark A. Lemley & Nathan Myhrvold, How to Make a Patent Market, 36 Hofstra L. Rev. 257, 257–59 (2007) (noting that patents exist in a “blind market” because of the confidentiality of patent license terms and suggesting mandatory publication of patent license terms); Christopher R. Leslie, Patents of Damocles, 83 Ind. L.J. 133, 169–70 (2008) (highlighting how creative enforcement and settlement strategies by patentees have resulted in a limited number of reported cases finding Walker Process liability); Michael Risch, Patent Portfolios as Securities, 63 Duke L.J. 89, 94 (2013) (arguing that “patent markets are opaque”). ↑
- .John R. Allison et al., Patent Quality and Settlement Among Repeat Patent Litigants, 99 Geo. L.J. 677, 680 (2011); Jay P. Kesan & Gwendolyn G. Ball, How Are Patent Cases Resolved? An Empirical Examination of the Adjudication and Settlement of Patent Disputes, 84 Wash. U. L. Rev. 237, 258–59, 271–75 (2006). ↑
- .Lemley estimates about 3.5 times as many patents are licensed for revenue as are ever litigated. See Mark A. Lemley, Rational Ignorance at the Patent Office, 95 Nw. U. L. Rev. 1495, 1507 (2001) (noting that there is about a 5% licensing rate and about 1.5% of patents are litigated). Others estimate similar or higher numbers. See, e.g., Steven C. Carlson, Patent Pools and the Antitrust Dilemma, 16 Yale J. Reg. 359, 385 (1999) (“Most infringed patents are not worth defending in court . . . . Even in the pharmaceutical industry, where patents are most valuable, eight out of ten patents typically produce no value for their holders.” (footnotes omitted)); Colleen V. Chien, Presentation to DOJ/FTC Hearing on Patent Assertion Entities (Dec. 10, 2012), https://papers.ssrn.com/sol3/papers.cfm?abstract_id=2187314 [https://perma.cc/Q5S9-N3RP] (estimating a high demands-to-lawsuits ratio); Global and Innovation-Based Competition: Hearings Before the Fed. Trade Comm’n (1995) (statement of F.M. Scherer, Professor, Harvard Univ.) (noting a preference for avoiding litigation and possible major divestiture); see also Shubha Ghosh & Jay Kesan, What Do Patents Purchase? In Search of Optimal Ignorance in the Patent Office, 40 Hous. L. Rev. 1219, 1229 & n.58 (2004) (noting that high litigation costs prevent many patents from going to trial). ↑
- .See sources cited supra note 2. ↑
- .Lemley & Myhrvold, supra note 1, at 257. There are occasional exceptions. If a license fee is so large that it is material to the bottom line of a publicly traded company, it must be disclosed in stock filings. Mark A. Lemley & Carl Shapiro, Patent Holdup and Royalty Stacking, 85 Texas L. Rev. 1991, 2022 (2007). But that is rare. On the other extreme, some companies insist on being permitted to disclose that they didn’t pay for a license in resolving a dispute. But that normally happens only once there is a lawsuit on file or if for some other reason the demand has become public; if no one knows you’ve even been approached about a license, there is no reason to announce that you didn’t pay to take one. ↑
- .One important exception is the market for patent sales. Unlike nonexclusive licenses, patent sales often are exposed to the public because they occur at auction, in bankruptcy, or as part of the sale of a company. Some, including two of the authors, have studied the market for brokered patent sales. See Brian J. Love, Kent Richardson, Erik Oliver & Michael Costa, An Empirical Look at the “Brokered” Market for Patents, 83 Mo. L. Rev. 359 (2018). ↑
- .See sources cited supra note 3. ↑
- .The conventional wisdom that icebergs are 90% underwater, unlike much conventional wisdom, actually turns out to be true. Sam Hokin, The Physics of Everyday Stuff: Icebergs, Bsharp (Nov. 9, 2018), http://www.bsharp.org/physics/icebergs [https://perma.cc/7TNU-D4MN]. ↑
- .We also did not include membership in groups like Allied Security Trust (AST), Rational Patent Exchange (RPX), or Unified Patents. Those groups may take patent licenses in bulk for their clients or otherwise buy up patents to prevent them from being asserted. But those deals don’t generally result from patent assertions made directly to our survey respondents. ↑
- .We used claim charts as a rough proxy for the seriousness of an assertion for a few reasons. To prepare claim charts, a patentee must identify one or more key patents and identify a product or service that infringes. The focus on specific patents and products signals that this is a negotiation about the actual value of the patent, not about the cost of litigation. It may signal that the patentee expects a significant payment. And it often accompanies face-to-face meetings to discuss the assertion. All that work takes time and money. That work is likely to signal a more serious assertion. ↑
- .As a result, we must depart in this Essay from the standard practice of releasing the raw data after publication. See Robin Feldman et al., Open Letter on Ethical Norms in Intellectual Property Scholarship, 29 Harv. J.L. & Tech. 339, 347–48 (2016) (proposing professional norms for IP scholarship). That practice is a good one, but here it would violate a commitment we felt we had to make in order to get companies to respond at all. We will make available as much data as we can consistent with that commitment. ↑
- .This is especially true when considering that internet surveys receive a lower response rate than surveys administered through other means. For a study on this, see Katja Lozar Manfreda et al., Web Surveys Versus Other Survey Modes: A Meta-Analysis Comparing Response Rates, 50 Int’l J. Mkt. Res. 79, 91–93 (2008). ↑
- .This introduces a potential bias in the responses because the universe of people we contacted may be unrepresentative in various ways. But it is also integral to the higher response rate. Response rates for unsolicited email surveys tend to hover around 1%–5%, which is far less than ours. In separate work, one of the authors is conducting a broader survey of all companies via unsolicited email contact. See Robin Feldman & Mark A. Lemley, The Sound and Fury of Patent Activity, Minn. L. Rev. (forthcoming 2019). ↑
- .Our companies covered various industries but were concentrated in the high technology industries. Broken down by primary product revenue category, the respondents included:
Consumer Goods 10 Data Services 1 Hardware 2 Internet 4 Payments 1 Semiconductor 2 Software 8 Telecom 2 Grand Total 30 Broken down by primary industry, the respondents included:
Automotive 1 Bio Tech 1 Construction 1 Energy 1 Entertainment 5 High Technology 18 Retail 1 Social 2 Grand Total 30 - .For surveys that focus on start-ups and patents, see generally Colleen V. Chien, Startups and Patent Trolls, 17 Stan. Tech. L. Rev. 461 (2014); Robin Feldman, Patent Demands & Startup Companies: The View from the Venture Capital Community, 16 Yale J.L. & Tech. 236 (2014); and Stuart J.H. Graham et al., High Technology Entrepreneurs and the Patent System: Results of the 2008 Berkeley Patent Survey, 24 Berkeley Tech. L.J. 1255 (2009). ↑
- .These numbers are estimates based on a lower midpoint in the bracketed range, except that for companies that reported 100 or more assertions, we estimated an average of 200 assertions after further investigation. We chose that point estimate because it seemed likely to us that companies responding to a survey by estimating rather than counting assertions tend to anchor towards the lower number. That is, if a company thinks it has somewhere around fifty assertions in a given year, give or take ten on either side, it is likely to put itself in the 51–100 bracket rather than the 26–50 bracket. We also ran an alternative analysis using the midpoint range estimate; we present the results in Appendix B for comparison. ↑
- .Note that assertions can fall into more than one category, so the percentages in this and other tables do not add to 100%. ↑
- .See sources cited supra note 3. ↑
- .Notably, the midpoint range estimate indicated that 212 out of 632, or 33.5% of, assertions involved litigation. The fact that the midpoint numbers diverged further from the observable litigation numbers is one reason we used the lower-than-midpoint range estimates throughout the paper. ↑
- .Most patent litigation occurs in the United States. See Lei Mei & E. Robert Yoches, Unique Aspects of U.S. Patent Litigation, Finnegan, Henderson, Farabow, Garrett & Dunner, LLP (Nov. 2007), https://www.finnegan.com/en/insights/unique-aspects-of-u-s-patent-litigation.html [https://perma.cc/VL37-4896] (“The United States has more lawsuits than any other country, including, for example, 2000-3000 patent lawsuits each year.”). And because the United States is the world’s largest market, it would be surprising if many companies found it worthwhile to obtain and enforce patents elsewhere but did not seek to do so in the United States. ↑
- .In the survey, we defined NPEs as companies or individuals that make more than half of their revenue from patent licensing. Our goal was to exclude universities and start-ups from the definition but to encompass companies that are in the business of asserting patents but that have a minor product as well. We note that at least one of the larger respondents classified claims by individuals as different from NPEs because it used a narrower definition of NPEs. We had that respondent include assertions by individuals as NPE assertions for our final data set. But it is possible that other companies drew a similar distinction without our knowing about it. If so, our data would underestimate the number of NPE assertions by lumping some assertions by individuals in with practicing entities. ↑
- .RPX data reported by Chien show that patent trolls (by their definition) accounted for 62% of suits and 59% of assertions in 2012. Colleen V. Chien, Patent Trolls by the Numbers 1, 3 (Santa Clara Univ. Legal Studies Research Paper No. 08-13, 2013), http://ssrn.com/abstract=2233041 [https://perma.cc/H8HC-WPLT]. Similarly, Feldman, Ewing, and Jeruss found that “patent monetization entities filed 58.7% of the patent lawsuits in 2012. This is a sharp rise from 2007, when patent monetization entities filed only 24.6% of patent infringement litigations.” Robin Feldman et al., The AIA 500 Expanded: The Effects of Patent Monetization Entities, UCLA J.L. & Tech., Fall 2013, at 1, 7. Cf. Christopher A. Cotropia et al., Unpacking Patent Assertion Entities (PAEs), 99 Minn. L. Rev. 649, 654–55, 692–94 (2014) (finding a lower number with more conservative definitions but still finding that practicing entities are a minority of suits). ↑
- .See Mark A. Lemley & A. Douglas Melamed, Missing the Forest for the Trolls, 113 Colum. L. Rev. 2117, 2129 (2013) (observing that many patent negotiations between practicing entities are resolved with cross-licenses, in part because each side bears risk if they litigate the dispute). In IT, business negotiations that are purely over patents but that don’t involve assertions are relatively rare because companies in the IT industry are generally interested in technology transfer, not just patent rights. See Colleen V. Chien, Software Patents as a Currency, Not Tax, on Innovation, 31 Berkeley Tech. L.J. 1669, 1702–03 (2016) (suggesting that parties may be inclined to monetize through “direct sales rather than assertion” as the “enforcement climate grows less favorable to patent holders”). ↑
- .See Daniel Klerman & Greg Reilly, Forum Selling, 89 S. Cal. L. Rev. 241, 242–43 (2016) (discussing forum shopping and using patent litigation in the Eastern District of Texas as an example); Brian J. Love & James Yoon, Predictably Expensive: A Critical Look at Patent Litigation in the Eastern District of Texas, Stan. Tech. L. Rev., Winter 2017, at 1, 6 (examining the Eastern District of Texas’s popularity with patent plaintiffs). The Supreme Court’s 2017 decision in TC Heartland LLC v. Kraft Foods Group Brands LLC, 137 S. Ct. 1514 (2017) may reduce the prevalence of forum shopping, but as of this writing its effects (and whether it would be faithfully applied by the Eastern District of Texas) are not clear. It may simply shift the forum to which plaintiffs gravitate. ↑
- .MedImmune, Inc. v. Genentech, Inc., 549 U.S. 118, 137 (2007). ↑
- .See, e.g., Mark Liang, The Aftermath of TS Tech: The End of Forum Shopping in Patent Litigation and Implications for Non-Practicing Entities, 19 Tex. Intell. Prop. L.J. 29, 42–43 (2010) (discussing how “NPEs file the bulk of their infringement actions in the Eastern District”). Our survey collects data on assertions in 2015, before TC Heartland changed the venue rules. ↑
- .See, e.g., U.S. FTC Settles First Case in Crackdown on ‘Patent Trolls’, Reuters (Nov. 6, 2014), https://www.reuters.com/article/usa-patents-ftc/update-1-u-s-ftc-settles-first-case-in-crackdown-on-patent-trolls-idUSL1N0SW1ZF20141106 [https://perma.cc/K5DW-82EM] (discussing MPHJ Technology Investments, which “sent letters to more than 16,000 businesses accusing them of infringing” but never filed any legal action). ↑
- .Mark A. Lemley, Ignoring Patents, 2008 Mich. St. L. Rev. 19, 22 (2008). ↑
- .Colleen V. Chien, Of Trolls, Davids, Goliaths, and Kings: Narratives and Evidence in the Litigation of High-Tech Patents, 87 N.C. L. Rev. 1571, 1603 (2009); Robin Feldman & Evan Frondorf, Patent Demands and Initial Public Offerings, 19 Stan. Tech. L. Rev. 52, 79 (2015). ↑
- .The numbers in this table report the number of companies in each category. The rows represent the number of patent assertions in 2015, and the columns represent company revenue in that year. Our breakdowns are based on annual revenue, as follows:$ < 100M
$$ = 100M–1B
$$$ = 1B–4B
$$$$ = 4B–15B
$$$$$ ≥ 15B ↑ - .See Chien, supra note 15, at 465 (analyzing the significant operational impact that is caused by patent demands); Feldman, supra note 15, at 263–65 (analyzing patent demands against venture-backed companies). ↑
- .See Dan L. Burk & Mark A. Lemley, The Patent Crisis and How the Courts Can Solve It 49–65 (2009) (documenting the industry-specific nature of the patent system). ↑
- .See sources cited supra note 3. ↑
- .See, e.g., Ashish Arora et al., Markets for Technology: The Economics of Innovation and Corporate Strategy 29–44 (2001) (discussing the size and scope of markets for technology). ↑
- .Robin Feldman & Mark A. Lemley, Do Patent Licensing Demands Mean Innovation?, 101 Iowa L. Rev. 137, 155 n.40 (2015) [hereinafter Feldman & Lemley, Innovation?] (citing Arora, supra note 33); Feldman & Lemley, Sound and Fury, supra note 13. Cf. Lemley & Myhrvold, supra note 1, at 258 (suggesting a way to enlarge and improve the market for patent licensing). ↑
- .Fed. Trade Comm’n, Patent Assertion Entity Activity: An FTC Study 10, 91–92 (2016). ↑
- .For an example of a case dropped for no payment, see AdjustaCam, LLC v. Newegg, Inc., 861 F.3d 1353 (Fed. Cir. 2017). ↑
- .See Am. Intellectual Prop. Law Ass’n, Report of the Economic Survey 2017 at 41 (2017) (reporting median costs of $3 million per side through trial for high-value cases). ↑
- .Because our goal was to generate estimates across all the assertions in our survey, we don’t distinguish between lawsuits and assertions for which no suit was filed. Assertions that lead to litigation will be naturally more expensive, but the point is to get a mean estimate including the possibility of litigation costs. ↑
- .Note that these are three different efforts to arrive at a total number. They should not be added together. ↑
- .Prior estimates of the cost of NPE litigation in the United States approximate it at $80 billion per year. James Bessen, Jennifer Ford & Michael J. Meurer, The Private and Social Costs of Patent Trolls, Regulation, Winter 2011–2012, at 26, 26, https://object.cato.org/sites/cato.org/files/serials/files/regulation/2012/5/v34n4-1.pdf [https://perma.cc/AA5P-K3C5] [hereinafter Bessen et al., Costs of Patent Trolls]. Bessen & Meurer’s numbers are not strictly comparable because they aim to measure only the costs of NPE disputes, not all enforcement efforts. Bessen and Meurer separately estimate NPE costs of $29 billion in 2011. Bessen & Meurer, supra note 1, at 389. For criticism of this study and its methodology, see generally David L. Schwartz & Jay P. Kesan, Analyzing the Role of Non-Practicing Entities in the Patent System, 99 Cornell L. Rev. 425 (2014). ↑
- .See John R. Allison et al., How Often Do Non-Practicing Entities Win Patent Suits?, 32 Berkeley Tech. L.J. 237, 239 (2017) (noting that NPE suits “account for a majority of all defendants sued for patent infringement”); Chien, supra note 22 (noting that PAEs brought about 62% of patent litigation in 2012); Cotropia et al., supra note 22, at 692–94 (comparing findings from different studies); Feldman et al., supra note 22, at 7 (“[P]atent monetization entities filed 58.7% of the patent lawsuits in 2012.”). ↑
- .Allison et al., supra note 1, at 1093 tbl.1. ↑
- .The measure is not exact. First, that study involved suits filed in 2008 and 2009 and decided from 2009 to 2013. Second, it measures cases that went to interim or final decision, which may differ from cases filed. Id. at 1125–32. ↑
- .It is not clear what implications our data have for costs in other industries. On the one hand, those industries may face even fewer unseen assertions. On the other hand, they almost certainly face fewer NPE assertions, which we class as significantly cheaper than competitor assertions. So the overall cost to the economy might be either lower or higher than the $80 billion estimate depending on how those variables interact. ↑
- .Lemley, supra note 3, at 1502. ↑
- .United States GDP, Trading Econ., https://tradingeconomics.com/united-states/gdp [https://perma.cc/Z4QZ-N9BP]. ↑
- .We don’t know what share of the cost of patent enforcement against our surveyed companies is attributable to entirely foreign assertions. There are reasons to think it isn’t that great. First, the companies we surveyed are predominantly U.S. companies. Second, the United States is significantly more litigious than other countries. Third, comparing our respondents’ self-report of worldwide lawsuits to actual data about U.S. lawsuits against those companies suggests that 88% of their cases involve at least one U.S. lawsuit. Finally, U.S. litigation and U.S. damage awards both tend to be more expensive than litigation in other countries. ↑
- .Notably, this isn’t the cost of the patent system as a whole, just the cost to targets of patent enforcement. It does not include technology transfer and normal licensing transactions or the costs of patent acquisition, which are outside the scope of this Essay. ↑
- .UNESCO Institute for Statistics, Research and Development Expenditure (% of GDP), World Bank, https://data.worldbank.org/indicator/GB.XPD.RSDV.GD.ZS [https://perma.cc/3YXT-P246]. ↑
- .Raymond M. Wolfe, Business R&D Performed in the United States Reached $356 Billion in 2015, Nat’l Sci. Found. (Aug. 22, 2017), https://www.nsf.gov/statistics/2017/nsf17320/ [https://perma.cc/R85M-YQUP]. ↑
- .But see Bessen et al., Costs of Patent Trolls, supra note 40, at 33 (finding that NPEs pass on only a small fraction of their revenue to investors). ↑
- .As noted above, we have excluded from our survey business transactions that also include IP rights. And Feldman and Lemley have shown elsewhere that ex-post assertions of patents outside that business context almost never involve technology transfer or lead to the development of new products. Feldman & Lemley, Innovation?, supra note 35, at 160, 174. ↑