Measuring Tax Literacy in a Politically Charged Climate
Introduction
This Article reports the findings of a survey measuring tax literacy on politically charged issues, such as how much high-income earners and large corporations pay in taxes. The results illuminate numerous aspects of tax literacy, including differences based on gender, socioeconomic status, and political affiliation. This study also uncovers novel internal inconsistencies between policy preferences and stated beliefs about taxation. This finding highlights the effects of deceptive media coverage and deceptive political rhetoric. Other topics discussed include the importance of tax literacy to a democracy, the ability of tax education to improve tax literacy, and the association between tax literacy and tax compliance.
The importance of tax literacy would be difficult to overstate. A basic understanding of taxes has the potential to affect decisions in nearly every aspect of one’s life. Tax rates have even been shown to influence athletic performance in professional athletes.[1] Tax literacy also affects a wide array of other academic disciplines. Much economic literature is premised on the assumption that taxpayers make decisions based on an accurate understanding of the effects they will have on taxation.[2] This assumption is also fundamental to the study of public finance.[3] Therefore, low tax-literacy rates call into question broad methodological assumptions in much research.
This Article proceeds in the following order. Part II provides a literature review explaining the tax-literacy studies that this study builds upon. Part III explains the methodology used in the present study. Part IV provides the results of this study. Part V discusses the significance of the findings. Part VI concludes by considering how this study is likely to spark future research on the subject.
I. Literature Review
This part will review the relevant literature regarding tax literacy. While there has been a lot of research on financial literacy, there is, unfortunately, much less research on tax literacy.[4] And there is even less research on how tax literacy relates to political affiliation and stated tax preferences.
A 2006 study found that about half of those surveyed mistakenly believed a majority of families have to pay estate tax, when in reality less than 1% of U.S. decedents had a taxable estate.[5] A 2013 study found that almost half of taxpayers who are eligible for the charitable deduction were not even aware of its existence.[6] A 2016 study found that a significant number of households misunderstand the Child Tax Credit.[7] A 2017 study found that people underestimate their marginal tax rate on salaries and overestimate their marginal tax rates on dividend income, thus underestimating the tax-advantaged status of dividend income.[8] A 2018 study found that 85% of those surveyed overstate their average income-tax rates and that the average overstatement was 83%.[9] A 2021 survey found that a majority of Americans mistakenly believed that the marginal tax rate is applied to all income.[10] These stark results of low tax literacy appear to be the culmination of a steady trend since the 1960s of taxpayers becoming less and less tax literate.[11]
The studies that analyzed tax literacy at the demographic level produced mostly consistent results. Males tend to have higher tax-literacy rates than females.[12] Black and Hispanic people tend to have lower tax-literacy rates than white people,[13] although one study found that with charitable deductions, white people were more likely to be mistaken than Black and Hispanic people.[14] Higher-income people tend to have higher tax-literacy rates than lower-income people.[15] Tax-literacy rates among conservatives and liberals are generally found to be equivalent.[16] Older people tend to have higher tax-literacy rates than younger people.[17] Finally, higher education generally corresponds to higher tax-literacy rates.[18]
The existing literature regarding tax literacy and political implications is relatively sparse given the public policy implications. A 2008 study found a significant negative correlation between politicians either raising or lowering taxes and the subsequent change in votes received.[19] This correlation remained even if the change left total tax revenues unaffected.[20] This appears to be universally the case, as a subsequent 2009 study of nineteen countries found a similar result.[21] Studies have found that more salient consumption taxes result in more responsiveness from taxpayers in altering their behavior accordingly.[22] The opinion that the rich do not pay their fair share is popularly held and is a significant factor in tax policy preferences.[23] Finally, higher tax literacy corresponds to better tax compliance.[24]
II. Methodology
This part describes the survey conducted to analyze tax literacy. The survey was administered online through the Qualtrics platform in October of 2023. Participants were recruited from MTurk and received a monetary reward upon successful completion of the survey. Excluding incomplete responses and responses that failed the attention check, a total of 136 usable responses were collected. The average age of the participants was 44.5.[25] Male participants comprised 64.7% of the respondents, and female participants comprised 35.3%.
After an Institutional Review Board consent form, the survey implemented a CAPTCHA test requirement. Participants were then asked the following seven demographic questions: age, sex, highest level of education, political affiliation, and parents’ combined highest annual income. Then, the survey asked the following six multiple-choice questions:
1) Which best describes your opinion on whether the rich pay their fair share of taxes?
2) If you got to set the rules, how much would someone who makes a $10 million salary pay in total taxes? This includes state taxes, local taxes, property taxes, social security taxes, federal income taxes, etc.
3) What percent of federal income tax revenue is paid by the top 1% of income earners?
4) What percent of federal income tax revenue is paid by the bottom 50% of income earners?
5) What is the current, highest, federal income tax rate?
6) What percent of Fortune 500 companies that had annual profits paid income taxes?
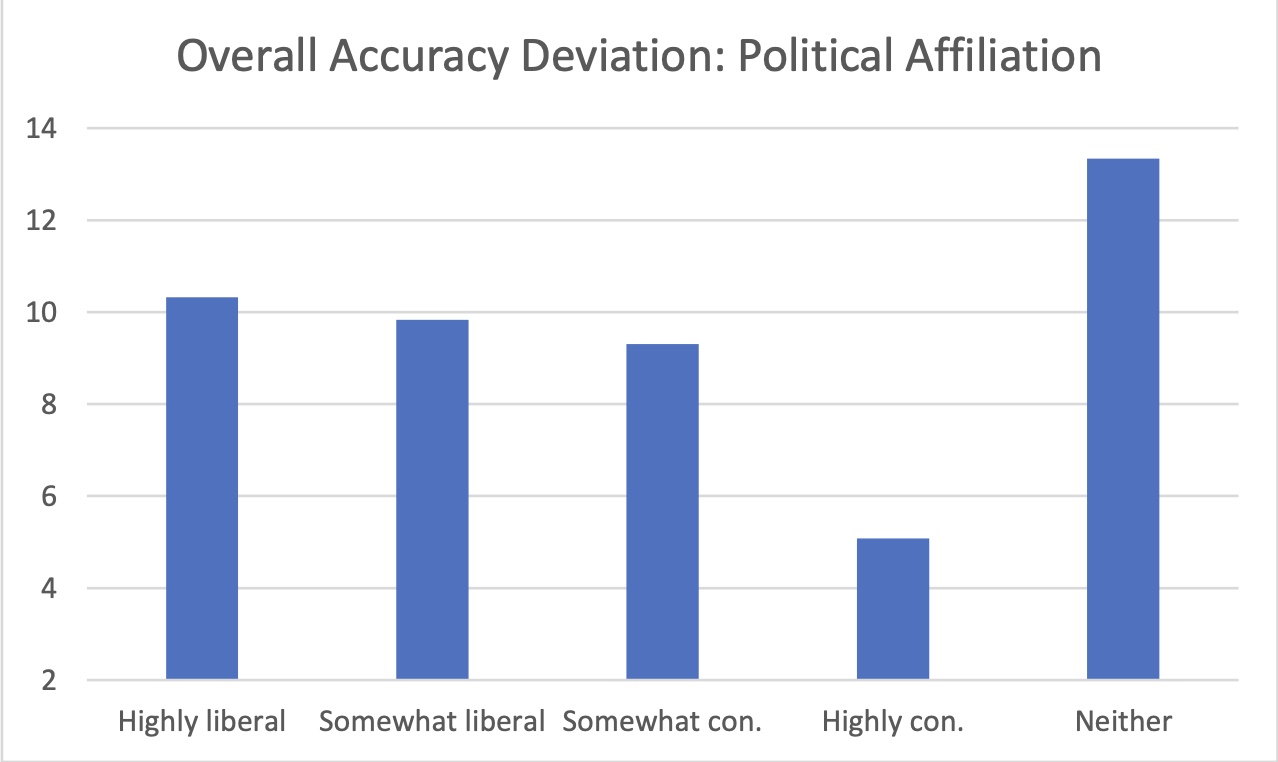
To measure the overall tax literacy of the demographic groups from this study, the average deviations from the correct answers on the four objective questions—three, four, five, and six—were calculated.
III. Results
A. The Rich
Analysis of the data produced numerous, informative results. The question regarding opinions on whether the rich pay their fair share provided five options ranging from absolutely not, probably not, roughly their fair share, probably more than their fair share, and absolutely more than their fair share. The average response was between absolutely not and probably not.[26] The opinion that the rich do not pay their fair share was consistent after controlling for demographic factors including age, sex, level of education, and parents’ income. However, there were differences based on political affiliation, with liberals more likely than conservatives to state that the rich do not pay their fair share of taxes (although conservatives, on average, also stated that the rich do not pay their fair share). The correlation between political affiliation and belief that the rich do not pay their fair share of taxes is well below the 0.05 threshold significance at a p-value of 3.29E-18. 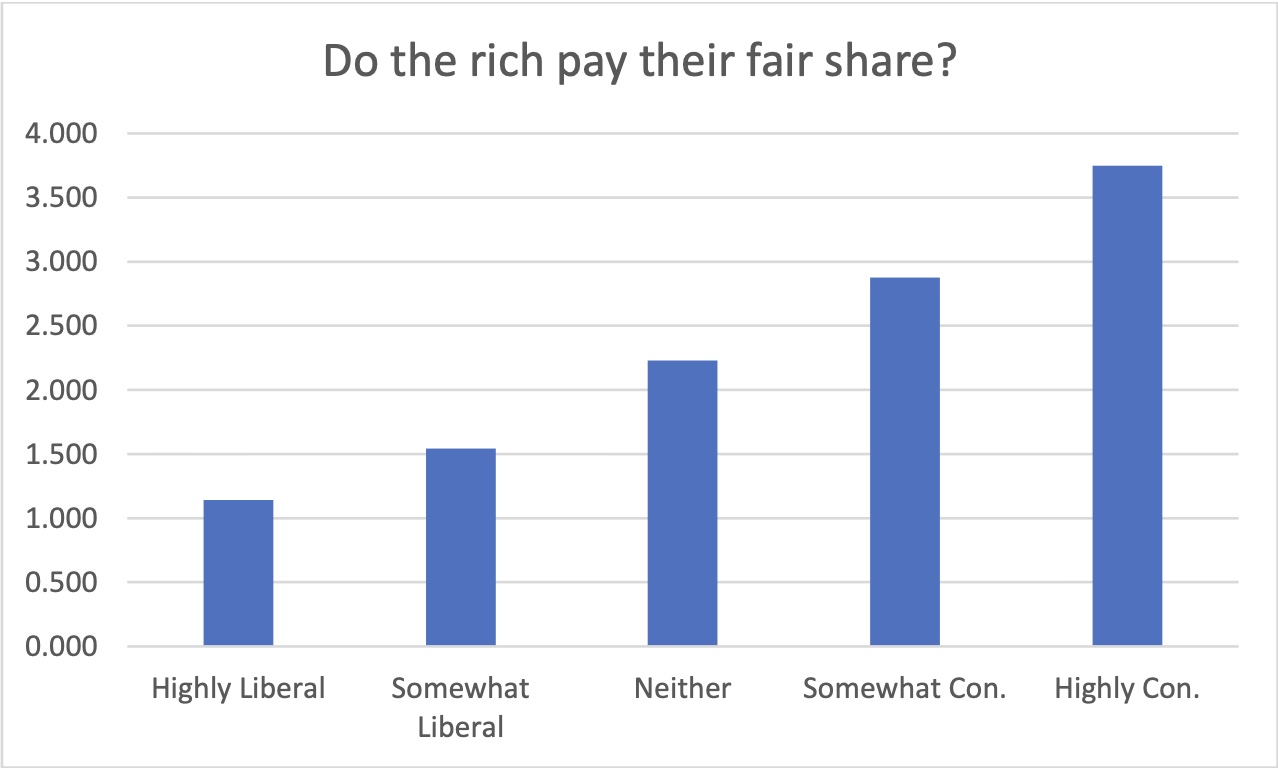
The related question of how much someone who makes a $10 million salary should pay in total taxes produced somewhat contradictory results compared to the widespread support for how the rich do not pay their fair share. The average of all the responses was $2.91 million. The correlation between political affiliation and how much the rich should pay was largely as expected, with “highly liberal” averaging $3.6 million, “somewhat liberal” averaging $3.25 million, “neither liberal nor conservative” averaging $2.3 million, “somewhat conservative” averaging $2.1 million, and “strongly conservative” averaging $2.45 million. This finding demonstrates strong statistical significance, with a p-value of 4.1E-5.
B. Accuracy
Unlike the first two subjective questions, the last four questions in the survey had objectively correct answers. This allowed for the participants to be measured based on their tax literacy. For the purposes of this study, deviations above or below the correct answer were treated the same.
The average federal income tax paid by the top 1% of income earners as a percent of total federal income tax collected is 42.3%.[27] The average estimate from this study was 12.1%. The average conservative answer was 22.6%, the average liberal answer was 7.3%, and the average for “neither conservative nor liberal” was 17.1%.
The average federal income tax paid by the bottom 50% of income tax earners as a percent of total federal income tax collected is 2.3%.[28] The overall estimate from this survey was 21.3%. The average estimate by conservatives was 15.5%, liberals averaged 26.9%, and “neither liberal nor conservative” averaged 23.6%.
The highest federal income tax rate is 37%.[29] Here, the estimates were far more accurate, with an overall average of 36.4%. Conservatives averaged 38.6%, liberals averaged 35.9%, and “neither liberal nor conservative” averaged 39.5%.
Based on available recent data, it is estimated that 14% of Fortune 500 companies that turned a profit in 2020 paid no federal corporate tax.[30] The overall average estimate in this study was 31.2%. Conservatives averaged 39.8%, liberals averaged 28.9%, and “neither liberal nor conservative” averaged 26.7%.
The overall results of the tax literacy analysis found that conservatives were more accurate than liberals, with the most accurate predictions coming from the “strongly conservative” group. The worst-performing group was the “neither liberal nor conservative” group.
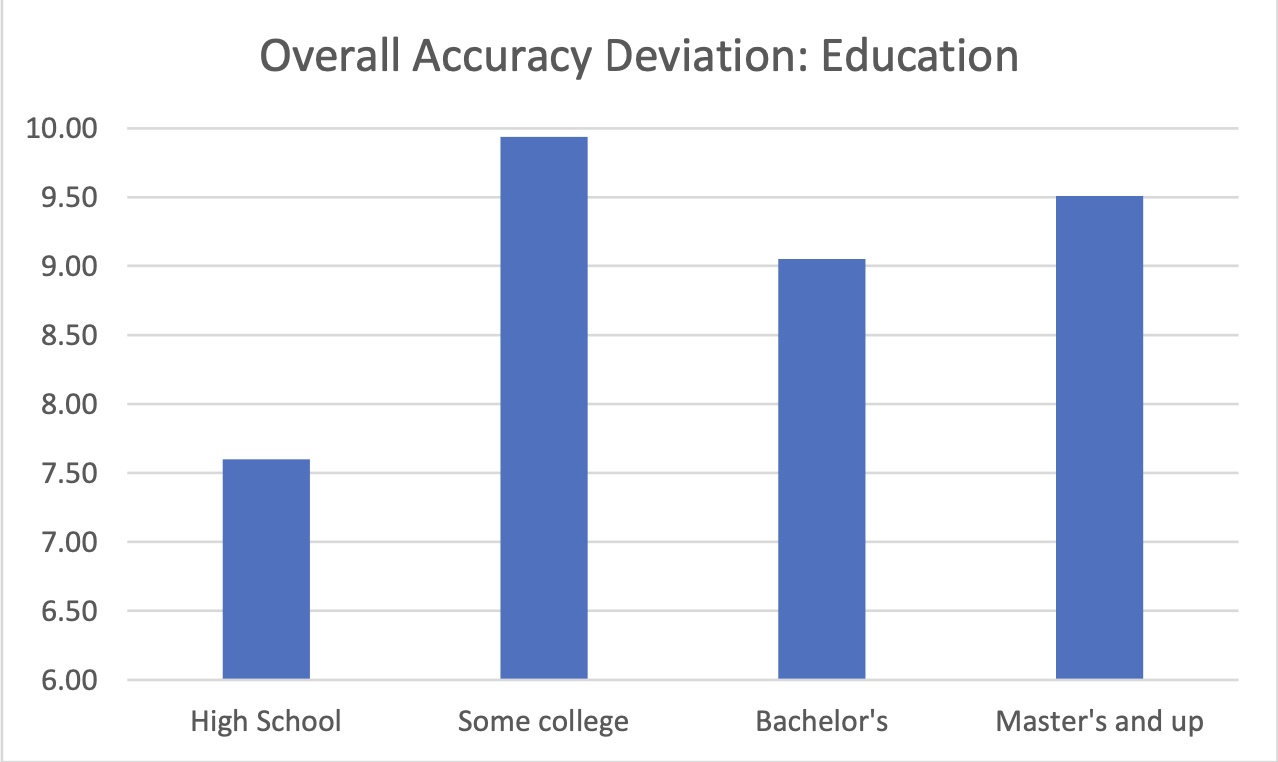
Surprisingly, this study found that those with a high school degree or less demonstrated more tax literacy than those with college experience.
Males tended to have higher tax-literacy rates than females. On average, the predictions from male respondents were 33.6% closer to the correct answer than the answers provided by female respondents. Analyzing the data based on parents’ income returned no statistically significant results. Also, analyzing the data based on age did not return any statistically significant results.
IV. Discussion
A. The Rich and Taxes
As with most studies on the subject, this study revealed overall low levels of tax literacy throughout all demographic factors. One of the starkest findings is the inconsistency between the opinion that the rich do not pay their fair share in taxes and a relatively low preferred amount that the rich should be paying. While a majority stated that they believe the rich do not pay their fair share in taxes, the average for how much someone with a $10 million annual income should pay in total taxes was only $2.95 million, or 29.5%. The actual amount paid in total taxes by someone with $10 million income would vary depending on a variety of factors. But 29.5% is likely less than what such a person would pay.[31] This inconsistency demonstrates both tax illiteracy and the likely effects such illiteracy can have on public policy preferences. Presumably, people who believe the rich do not pay their fair share of taxes would be more likely to vote for politicians who propose plans to increase taxes on the rich. Based on the results of this study, it appears that many people are inadvertently supporting tax policies that would produce an end result even further away from what they believe is a fair result.
Inconsistencies regarding how much high-wage earners pay in federal income taxes and whether or not this is enough is also demonstrated in another question in the present study. On average, participants estimated that the top 1% of income earners pay only 12.1% of the total federal income tax burden. This is more than three times less than the portion they actually pay of 42.3%. Even conservatives greatly underestimated the amount the top 1% pay, with an average estimate of 22.6%. This is likely a product of how politicians frequently campaign on how the rich do not pay their fair share of taxes.[32] Even Republican politicians rarely campaign on how the rich pay more than their fair share, wisely focusing instead on espousing vague notions of how everyone pays high taxes.[33]
However, survey participants’ ability to accurately predict the top marginal tax rate is somewhat inconsistent with the previously discussed misunderstandings regarding how much top income earners pay in taxes. The overall estimate for the top marginal tax rate was 36.4%, remarkably close to the correct answer of 37%. But these same survey participants stated that, on average, top income earners should pay only 29.1% in combined taxes while concurrently maintaining that these people do not currently pay their fair share. Perhaps this inconsistency is the result of an assumption that there exist ample loopholes for the top income earners to avoid paying anything close to their marginal tax rate. The discrepancy found in this survey between accurately predicting the highest marginal tax rate while underestimating how much in taxes the highest income earners pay is further peculiar in that it is inconsistent with another commonly held tax misunderstanding, that of how being bumped into a higher tax bracket can result in less gross take home pay.[34] The mistaken belief that high-income individuals pay far less in federal income taxes than they actually do pay appears to be widespread. For example, a 2006 study found that respondents mistakenly believed that high-income individuals’ tax burdens would go up under a flat tax.[35]
Some of this apparent inconsistency may be due to confusion regarding the difference between taxes paid by the top income earners (what this survey question was explicitly about) and taxes paid by the wealthiest individuals. For example, many recall that Warren Buffett and President Barack Obama publicized how Buffett pays a lower tax rate than his secretary.[36] Politicians used this to promote a “Buffett Rule” for tax policy.[37] While some have called into question the accuracy of Buffett’s claim,[38] even assuming it is true, it is likely misleading, as Buffett is an extreme outlier. He receives a disproportionate amount of his income in the form of capital gains, is very charitable, and lives a very modest lifestyle, thus avoiding high property taxes and luxury taxes.[39] But even setting aside those caveats, many mistakenly believe that Buffett’s statement was not about income tax rates but rather that Buffett pays less in taxes than his secretary. This false belief among lay people is understandable given media coverage of the matter. A New York Times headline claimed that “The Rich Really Do Pay Lower Taxes Than You.”[40] This is highly deceptive, as the article only refers to tax rates, but the title refers to taxes paid.[41]
Politicians also deceptively make statements that imply the middle class pays more taxes than the rich, when they are really referring to tax rates.[42] For example, President Obama stated, “Middle-class families shouldn’t pay higher taxes than millionaires and billionaires. That’s pretty straightforward. It’s hard to argue against that.”[43] And most people would certainly agree with this statement because they would assume the statement refers to the middle class paying more in taxes, rather than paying less in taxes but paying a higher tax rate relative to their income.
Elsewhere we see advocates promote the message that we should “tax the rich.” This implies that the rich are not already being taxed. At the 2021 Met Gala, Congresswoman Alexandria Ocasio-Cortez received widespread attention for wearing a dress that had the message “Tax the Rich” written in large letters on it.[44] A recent book promoting higher taxes on the rich is titled “Tax the Rich!”[45] The book, which conveniently omits how much the rich actually pay in taxes, claims that “those with little to spare are responsible for most of the [tax base], while those with the most put up the equivalent of nothing . . . .”[46] The results of this survey support the notion that the deceptive ways in which the media and politicians refer to certain taxation issues have produced confusion.
B. Political Affiliation
In existing research, tax-literacy rates based on political affiliation generally do not vary significantly.[47] The present study found consistent and significant differences in tax literacy based on political affiliation. One potential explanation for this is that this survey was conducted in 2023, which was a highly politically polarizing time,[48] and that the questions asked were likewise more politically charged than those in other tax-literacy research. This study asked about the rich paying their fair share and how much large corporations pay in taxes. These are more politically charged questions than other studies that ask about issues such as how the Earned Income Tax Credit and the Child Tax Credit are applied, policies that both Republicans and Democrats generally support.[49]
Additionally, the unique results found in the present study may be partially the product of cognitive anchoring. By asking about the politically charged, subjective issue of whether the rich pay their fair share first, this may have primed participants to become anchored to the positions generally associated with their political parties for the objective questions that followed. Cognitive anchoring is a powerful mental heuristic whereby putting someone in a given frame of mind will drastically affect how they respond to subsequent questions.[50]
However, while this may help explain the difference in tax literacy between conservatives and liberals in the present study, it does not explain why those identifying as “neither liberal nor conservative” demonstrated the lowest tax literacy. With the explanation regarding a politically charged climate and politically charged questions, one would expect a consistent trend in tax literacy based on political affiliation, with “neither liberal nor conservative” in the middle of the spectrum.
C. Gender and Age
The result from this study that males demonstrated higher levels of tax literacy is consistent with the existing literature.[51] The result in the present study, that there was no statistically significant difference regarding tax literacy based on age, is at odds with the existing literature.[52] However, this could be a function of how the survey participants were much older than anticipated.
D. Importance of Tax Literacy
Tax literacy is an integral part of financial literacy.[53] It is instrumental in managing personal finances.[54] A basic understanding of the tax code could result in significantly altered behaviors related to moving to a different state, deciding to have a spouse leave the workforce, having a child, donating to charities, going back to college to pursue a higher-wage career, and in considering whether to pursue work as an employee or an independent contractor, whether to rent or buy a house, whether the environmental tax incentives to buy an electric vehicle or insulate one’s house are worth it, etc. These decisions all have tax ramifications, but as studies on tax literacy demonstrate, the perceptions of these effects often do not align with the realities of the effects.[55] This is important, as tax policy is often used as a method to incentivize certain behaviors. If people are unaware of the tax policy or its effects, then they will not be incentivized.
Tax literacy is especially important in a democracy in which voters elect the politicians who set tax policy. Misunderstandings in the electorate regarding tax policy could incentivize politicians to promote tax policies that are rooted in false assumptions. For example, it appears that widespread ignorance regarding the estate tax—namely that it applies to middle-class families—resulted in support for its reduction under the Bush administration.[56] And a 2018 study found that those who erroneously believe they are paying more in taxes than they really are disproportionately believe that their taxes should be lowered and that tax dollars are spent inefficiently.[57]
Higher tax literacy in the electorate could also lead to benefits tangentially related to tax policy. For example, it could lead to a better understanding of campaign promises by politicians. This is because tax literacy could foster a more realistic balancing of the tradeoffs involved in funding such government programs. Additionally, increased tax literacy in the electorate could lead to politicians feeling more comfortable getting into specifics as to how their proposals will be funded, and it may lead to politicians being more hesitant to mislead the electorate with deceptive campaign promises.
The Organisation for Economic Co-operation and Development (OECD) explicitly recognizes the importance of tax literacy. To ensure that citizens are aware of their rights and responsibilities regarding the fiscal contract and holding their respective governments accountable, the OECD emphasizes the importance of tax literacy.[58] And in 2015, the OECD released the publication Building Tax Culture, Compliance and Citizenship: A Global Source Book on Taxpayer Education, which further highlighted the need for tax literacy.[59]
Finally, higher tax literacy corresponds to higher tax compliance.[60] This effect is especially promising given the findings of this research. Namely, if people mistakenly believe that the rich do not pay their fair share but then learn that they actually pay more than what is perceived to be their fair share, this may enhance tax compliance by increasing perceptions of fairness for the majority of taxpayers.
E. Bounded Rationality
Ignorance regarding tax policy is not necessarily irrational behavior, as understood in the context of bounded rationality.[61] Yes, the information regarding taxes is readily available, and the vast majority of taxpayers are intelligent enough to understand the basic elements asked in this study. However, while information regarding tax policies is free monetarily, it may be perceived to come at significant cognitive and temporal cost. Given finite cognitive and temporal resources, people must balance the benefits of better understanding the tax code with the costs. Additionally, paying taxes is generally experienced as unpleasant, and therefore spending more time thinking about it is understandably avoided. For many people, the costs may simply outweigh the benefits. This is especially true for those who simply take the standard deduction and those who employ a tax accountant who can tell them what behaviors would be advantageous without having to explain the tax code in detail. Similarly, the presence of inexpensive online-tax preparation services that are designed to find any available tax breaks further illustrate that low tax literacy in some people is not necessarily irrational behavior.
The principle of bounded rationality is also consistent with the results in this study and in the existing literature that men generally have higher tax-literacy rates than females.[62] This is because in a two-parent, opposite-sex household, the man is more likely to take care of the financial planning.[63] And principles of effective division of labor proscribe that the husband and wife do not both need to be well versed in tax policy.
F. Tax Education
The results of this study elicit discussion regarding various aspects of tax education. Because tax policy is often used to modify taxpayer behavior, some have argued that this requires a populace that is aware of tax implications, and therefore tax education is an important element of creating and maintaining a successful tax system.[64] But in the present study, the demographic demonstrating the highest levels of tax literacy was those with only a high school degree or less. These results support the notion that not only does higher education not per se increase tax literacy, but that it may even make it worse. This result could also be used as an argument in favor of simplifying the tax code. After all, if technical changes to the tax code intended to alter behavior are not effective due to low tax literacy, perhaps this is just unnecessary complexity. Tax policy that simplifies the tax code such as a flat tax, reduced deductions, and reduced credits may be preferable.
V. Conclusion
The present study contributes to the existing tax literature research in numerous ways. It confirms the broad principles from existing research. Its novel use of politically charged tax questions uncovered significant disparities based on political affiliation. This first-of-its-kind methodology illuminates the effects of deceptive media coverage and deceptive political rhetoric. This further paints a skeptical picture regarding the ability of increased tax literacy education to provide the benefits of a healthy democracy, increased understanding, and increased tax compliance.
This study will hopefully serve as a powerful catalyst for future replication with variation. There are many other aspects of the tax code that are commonly misunderstood. By including these in a future study, the relationship between tax-literacy rates for politically charged questions and tax-literacy rates for more practical, neutral questions could be measured.[65] Future studies could be expanded in scope by gathering more information. They could ask participants their level of confidence in their answers to measure any correlation between tax literacy and confidence. This is highly relevant to tax-literacy research, as one who is aware of one’s low tax literacy is less harmful than one who is highly confident in one’s false beliefs. More nuanced distinctions regarding political affiliation could be utilized, such as distinguishing between anti-Trump Republicans and pro-Trump Republicans. Participants could be asked to identify the amount and source of news media they consume. Based on the results of this study, it is possible that more news consumption correlates to lower, rather than higher, tax literacy. Additionally, such a question would shed light on the effects of social media outlets to spread false information and the debate surrounding the proper role of these companies monitoring and correcting false or misleading information. There is some evidence to suggest that because the news media generally focuses more on the negative, increased media consumption over the last sixty years could be partially responsible for the corresponding decrease in tax literacy.[66]
- Michael Conklin & Jordan Daniel, Taxes and Athletic Performance: Why NBA Players Perform Better in Low-Tax States, 24 Hous. Bus. & TAX L.J. [2] (forthcoming 2024). ↑
- Charles L. Ballard & Sanjay Gupta, Perceptions and Realities of Average Tax Rates in the Federal Income Tax: Evidence from Michigan, 71 Nat’l Tax J. 263, 290 (2018). ↑
- Naomi E. Feldman, Peter Katuscak & Laura Kawano, Taxpayer Confusion: Evidence from the Child Tax Credit, 106 Am. Econ. Rev. 807, 807 (2016). ↑
- Elizabeth Lyon & J. R. Catlin, Consumer Misconceptions About Tax Laws: Results from a Survey in the United States, 43 J. Consumer Pol’y 807, 807 (2020). ↑
- Joel Slemrod, The Role of Misconceptions in Support for Regressive Tax Reform, 59 Nat’l Tax J. 57, 69 (2006). For the statistic on taxable estates, see Ballard & Gupta, supra note 2, at 266 n.8. ↑
- Jacob Goldin & Yair Listokin, Tax Expenditure Salience, 16 Am. L. & Econ. Rev. 144, 148 (2014). ↑
- Feldman, Katuscak & Kawano, supra note 3, at 818–20. ↑
- Michael Gideon, Do Individuals Perceive Income Tax Rates Correctly?, 45 Pub. Fin. Rev. 97, 101 (2017). ↑
- Ballard & Gupta, supra note 2, at 264. ↑
- Alan D. Viard & Jason L. Saving, Survey Confirms That Many Americans Misunderstand Income Tax Brackets, Amer. Enter. Institute (May 4, 2021), https://www.aei.org/economics/survey-confirms-that-many-americans-misunderstand-income-tax-brackets/. ↑
- See generally Ballard & Gupta, supra note 2(pointing to a 1965 study in which many understated their tax rates; a 1988 study in which taxpayers modestly understated their tax rates; a 1995 study in which respondents two-to-one overstated their tax rate; and the 2018 study itself, which found that 85% overestimated their tax rate). ↑
- See, e.g., Ballard & Gupta, supra note 2, at 276; Lyon & Caitlin, supra note 4, at 822. ↑
- Ballard & Gupta, supra note 2, at 276. ↑
- Goldin & Listokin, supra note 6, at 164. ↑
- See, e.g., Lyon & Catlin, supra note 4, at 807; Ballard & Gupta, supra note 2, at 277. ↑
- Ballard & Gupta, supra note 2, at 277. ↑
- Lyon & Catlin, supra note 4, at 818. ↑
- See, e.g., id.; Ballard & Gupta, supra note 2, at 276; Goldin & Listokin, supra note 6, at 164. ↑
- Benny Geys & Jan Vermeir, Taxation and Presidential Approval: Separate Effects from Tax Burden and Tax Structure Turbulence?, 135 Pub. Choice 301, 302, 314 (2008). ↑
- Id. ↑
- Erik R. Tillman & Baekkwan Park, Do Voters Reward and Punish Governments for Changes in Income Taxes?, 19 J. Elections Pub. Op. & Parties 313, 314 (2009). The countries analyzed were Australia, Austria, Belgium, Canada, Denmark, Finland, France, Germany, Ireland, Italy, Netherlands, New Zealand, Norway, Portugal, Spain, Sweden, Switzerland, United Kingdom, and the United States. Id. at 329. ↑
- Feldman, Katuscak & Kawano, supra note 3, at 809. ↑
- Gideon, supra note 8, at 113 (explaining that the belief in taxation-unfairness is rooted in two factors: taxes being too high and the rich not paying their fair share). ↑
- Young-dahl Song & Tinsley E. Yarbrough, Tax Ethics and Taxpayer Attitudes: A Survey, 38 Pub. Admin. Rev. 442, 449 (1978); Knut Eriksen & Lars Fallan, Tax Knowledge and Attitudes Towards Taxation; A Report on a Quasi-Experiment, 17 J. Econ. Psych. 387, 397–98 (1996) (finding similar results in a study from Norway). ↑
- In an effort to protect anonymity, age ranges were utilized instead of asking for the participant’s exact age. Therefore, the survey average age of 44.5 is an approximation. ↑
- Each of the five options were sequentially coded one through five, and the average was 1.93. ↑
- Erica York, Summary of the Latest Federal Income Tax Data, 2023 Update, Tax Found. (Jan. 26, 2023), https://taxfoundation.org/data/all/federal/summary-latest-federal-income-tax-data-2023-update/. ↑
- Id. ↑
- Federal Income Tax Rates and Brackets, Internal Revenue Serv., https://www.irs.gov/filing/federal-income-tax-rates-and-brackets. ↑
- Matthew Gardner & Steve Wamhoff, 55 Corporations Paid $0 in Federal Taxes on 2020 Profits, Inst. on Tax’n & Econ. Pol’y (Apr. 2, 2021), https://itep.org/55-profitable-corporations-zero-corporate-tax/. This is based on an estimated 55 Fortune 500 companies that paid no federal corporate tax and an estimated 400 Fortune 500 companies that were profitable. Id. ↑
- Because the question stipulated that this was “salary” and therefore not capital gains income, everything above $578,126 for a single person and $693,751 for married couples would be taxed at a rate of 37% according to the 2023 tax schedule. Federal Income Tax Rates, supra note 29. This would result in over $3.5 million, or 35% just in federal taxes alone (before any deductions and credits). Adding in state taxes, local taxes, property taxes, and payroll deduction taxes would further increase this number. ↑
- See, e.g., Brian Faler, Raising Taxes on the Rich Is an Easy Campaign Slogan, But It Won’t Be Easy, Politico (Nov. 7, 2020, 6:00 PM), https://www.politico.com/news/2020/11/07/joe-biden-policies-tax-433634. ↑
- For example, the 2017 Tax Cuts and Jobs Act reduced taxes for the middle class, the rich, and corporations. Tax Cuts and Jobs Act (TCJA), Tax Found., https://taxfoundation.org/taxedu/glossary/tax-cuts-and-jobs-act/. ↑
- See, e.g., Geoff Williams, 5 Myths About Taxes, U.S. News & World Rep. (Feb. 19, 2016), https://money.usnews.com/money/personal-finance/articles/2016-02-19/5-myths-about-taxes. This stems from the misunderstanding that one’s higher marginal tax rate applies to all income rather than just the income in that higher bracket. ↑
- See generally Slemrod, supra note 5. This supports the claim that people mistakenly believe the top income earners pay less than they actually do in federal income tax because the only way top income earners would pay more under a flat tax (under which everyone pays the same rate) is if they currently pay less. ↑
- See, e.g., Seniboye Tienabeso, Warren Buffett and His Secretary on Their Tax Rates, ABC News (Jan. 25, 2012), https://abcnews.go.com/blogs/business/2012/01/warren-buffett-and-his-secretary-talk-taxes. ↑
- See generally Nat’l Econ. Council, Exec. Off. of the President of the U.S, The Buffett Rule: A Basic Principle of Tax Fairness (2012). ↑
- See, e.g., Chris Edwards, Warren Buffett’s Tax Story is Bogus, Cato Inst. (Sept. 21, 2011, 2:14 PM), https://www.cato.org/blog/warren-buffetts-tax-story-bogus. ↑
- Angie Drobnic Holan, Does a Secretary Pay Higher Taxes Than a Millionaire?, PolitiFact (Sept. 21, 2011), https://www.politifact.com/article/2011/sep/21/does-secretary-pay-higher-taxes-millionaire/ (“Now does a secretary usually pay higher tax rates than a millionaire? The answer to that question is definitely not.”). ↑
- David Leonhardt, The Rich Really Do Pay Lower Taxes Than You, N.Y. Times (Oct. 6, 2019), https://www.nytimes.com/interactive/2019/10/06/opinion/income-tax-rate-wealthy.html. ↑
- To further explain, if a rich person and a middle-class person both went to McDonald’s and ordered the same meal, it would be highly deceptive to claim that “McDonalds charges the middle class less for food than the rich.” Yes, the rich person paid much less as a percent of his total income for the food, but the plain meaning of the statement is that it is referring to dollars spent. Likewise, the clear meaning of “pay lower taxes” is in reference to the dollar amount, not the ratio of income to taxes paid. ↑
- And even the statement that the rich pay lower tax rates than the middle class is deceptive, as high-income earners not only pay more in taxes than the middle class but also pay higher tax rates on average. Do the Rich Pay Their Fair Share?, Fed. Budget in Pictures, https://www.federalbudgetinpictures.com/do-the-rich-pay-their-fair-share/ (last updated Mar. 9, 2023) (explaining that in 2020, the top 1% of income earners paid 42% of all federal income taxes but earned only 22% of all income). ↑
- Holan, supra note 39. ↑
- Christi Carras, AOC Defends Polarizing ‘Tax the Rich’ Met Gala Dress: The Medium is the Message, L.A. Times (Sept. 15, 2021, 10:53 AM), https://www.latimes.com/entertainment-arts/story/2021-09-14/met-gala-2021-aoc-tax-the-rich-dress. ↑
- Morris Pearl, Erica Payne & The Patriotic Millionaires, Tax the Rich! How Lies, Loopholes, and Lobbyists Make the Rich Even Richer (2021). ↑
- Id. at xx–xxi. ↑
- Ballard & Gupta, supra note 2, at 277. ↑
- Mark Murray & Alexandra Marquez, Here’s What’s Driving America’s Increasing Political Polarization, NBC News (June 15, 2023, 2:06 PM), https://www.nbcnews.com/meet-the-press/meetthepressblog/s-s-driving-americas-increasing-political-polarization-rcna89559. ↑
- For evidence of the bipartisan nature of the Child Tax Credit, see, for example, Stephanie Hingtgen, House-Passed Bipartisan Tax Bill’s Child Tax Credit Expansion Would Especially Help Children Living in Rural Areas, Ctr. on Budget & Pol’y Priorities (Feb. 5, 2024, 12:30 PM), https://www.cbpp.org/blog/house-passed-bipartisan-tax-bills-child-tax-credit-expansion-would-especially-help-children. For Earned Income Tax Credit, see, for example, Robert Greenstein & Isaac Shapiro, New Research Findings on the Effects of the Earned Income Tax Credit, Ctr. on Budget & Pol’y Priorities (Mar. 11, 1998), https://www.cbpp.org/sites/default/files/archive/311eitc.htm (“Several states have established state earned income tax credits in recent years with bipartisan support, and the EITC has drawn praise from some leading conservative thinkers, as well as from liberals and moderates.”). ↑
- Michael Conklin, Combating Arbitrary Jurisprudence by Addressing Anchoring Bias, 97 Wash. U. L. Rev. Online 1, 1 (2019). ↑
- See, e.g., Lyon & Catlin, supra note 4, at 823; Ballard & Gupta, supra note 2, at 276–77 (finding on average that women overstate their income-tax rates more than men). ↑
- Lyon & Catlin, supra note 4, at 823. ↑
- Dajana Cvrlje, Tax Literacy as an Instrument of Combating and Overcoming Tax System Complexity, Low Tax Morale and Tax Non-Compliance, 4 Macrotheme Rev., Spring 2915, at 157–58 (2015). ↑
- See id. at 156 (“By acquiring basic knowledge of taxation and public expenditures, individuals become able to efficiently manage their personal finances and understand the basic logic of possible effects of fiscal policy.”). ↑
- See Goldin & Listokin, supra note 6, at 150 (“At the end of the day, taxpayers make decisions based on their perceptions of an activity’s costs.”) (emphasis added). ↑
- See Slemrod, supra note 5, at 69. ↑
- See Ballard & Gupta, supra note 2, at 264–65. ↑
- See generally Wilson Prichard, Org. for Econ. Coop. & Dev., Citizen-State Relations: Improving Governance Through Tax Reform (2010) (describing how increased tax literacy engenders more government accountability and a stronger buy-in from taxpayers). ↑
- See generally Org. for Econ. Coop. & Dev. & The Int’l & Ibero-Am. Found. for Admin. & Pub. Policies Building Tax Culture, Compliance and Citizenship: A Global Source Book on Taxpayer Education (2015) (comparing and drawing lessons from tax literacy programs in countries across the world). ↑
- Eriksen & Fallan, supra note 24, at 397–98 (finding that increased tax literacy resulted in more ethical tax behavior in a study from Norway); Anca Nichita, Larissa Batrancea, Ciprian Marcel Pop, Ioan Batrancea, Ioan Dan Morar, Ema Masca, Ana Maria Roux-Cesar, Denis Forte, Henrique Formigoni & Adilson Aderito da Silva, We Learn Not for School But for Life: Empirical Evidence of the Impact of Tax Literacy on Tax Compliance, 57 E. Eur. Econ. 397, 418–19 (2019); cf. Leslie Book, The Poor and Tax Compliance: One Size Does Not Fit All. 51 Kan. L. Rev. 1145, 1195 (2003) (observing that, while overall tax literacy is low, “the cost of detection [for tax cheats] is far less than the expected benefit of cheating”). ↑
- See, e.g., Why Are We Satisfied by “Good Enough?” Bounded Rationality Explained, The Decision Lab (2024), https://thedecisionlab.com/biases/bounded-rationality (explaining bounded rationality as a process where people make imperfect but acceptable decisions using limited information because of external limitations). ↑
- See, e.g., Ballard & Gupta, supra note 2, at 276 (finding that women overreport their tax liability more than men); Lyon & Catlin, supra note 4, at 822. ↑
- Lorie Konish, Women Are More Likely to Leave Financial Planning to Their Spouses. Here’s Why That’s a Problem, CNBC (Mar. 18, 2019, 2:50 PM), https://www.cnbc.com/2019/03/18/women-are-more-likely-to-leave-money-decisions-to-their-spouses.html. ↑
- See Cvrlje, supra note 53, at 161. ↑
- Examples of commonly misunderstood aspects of the tax code include the difference between credits and deductions, the misunderstanding that getting a raise that bumps you into a higher tax bracket applies to all income and therefore could lead to less take-home pay, the belief that most U.S. households are subject to the estate tax, and the ability of corporations to not incur any net cost of items that they “write off.” ↑
- Ballard & Gupta, supra note 2, at 290 (pointing to a likely trend since the 1960s that Americans have become increasingly more likely to overestimate their tax burden and that this may be the result of respondents who “have been influenced by decades of statements by commentators and politicians, to the effect that U.S. tax rates are unreasonably high.”). ↑