Local Legal Culture from R2D2 to Big Data
I. Introduction
If you ask Teresa Sullivan, Elizabeth Warren, or Jay Westbrook about the early years of their groundbreaking Consumer Bankruptcy Project (CBP), they eventually will tell you about R2D2, their mobile photocopier. They carted R2D2 across the country to copy the bankruptcy court records that formed the backbone of their examination of the lives of consumer bankruptcy filers. Courthouses charged twenty-five cents per page for photocopies, so it was cheaper to bring R2D2, although they had to purchase a separate airplane ticket for “him.” Journeying to courthouses across the country resulted in several anecdotes, such as the time R2D2 “made a break for it” on Grand Avenue in Chicago by sliding out of the back of the station wagon rented for the purpose of transporting the machine or when they had to lug R2D2 up three flights of stairs in Danville, Illinois.[1] In 1981, gathering data on consumer bankruptcy filers in three states took a tremendous amount of time and effort.
Once they had the data, analyzing it posed another hurdle. At the time of the first study, Westbrook had just obtained his first Apple II Plus, which was an order of magnitude slower than even today’s cell phones. To analyze their data, they used the campus mainframe. They could access it by telephone but had to hire a graduate student who knew how to operate it.
Fast-forwarding to today, we obtained a database with over 12.5 million records on every U.S. bankruptcy case that was pending sometime during the government fiscal years 2012–2016. We added Census Bureau data to estimate demographic and other characteristics by matching debtor zip codes to those in the Census database. We analyzed these data and obtained our results within weeks of formulating our analysis plan. We did this all without having to raise money or leave our offices.[2] Our world of ready data availability and computers to analyze them compares to photocopier R2D2 about the same as the world of science-fiction R2D2 compares to the U.S. Space Shuttle program (a contemporary of photocopier R2D2).
We do not use the term “groundbreaking” lightly when describing the early CBP. Sullivan, Warren, and Westbrook changed the nature of the consumer bankruptcy field. They shattered myths such as the idea that debtors were marginalized workers rather than part of the middle class.[3] They developed the dominant framework of why consumers file for bankruptcy, as reported by the debtors themselves: job loss, medical problems, and divorce.[4] They were the first research team to discover that fewer than half of chapter 13 cases receive a discharge.[5] Most importantly, Sullivan, Warren, and Westbrook created the norm of empirical research in the field, making it unacceptable to write about consumer bankruptcy without engaging in real-world analysis.
One key contribution of Sullivan, Warren, and Westbrook was putting “local legal culture” on the scholarly map. Along with Professor Jean Braucher, who was writing contemporaneously,[6] the CBP researchers realized that debtors experienced a theoretically federal and theoretically uniform consumer bankruptcy law very differently based on where they lived.[7]
In some areas of the country, such as Alaska, Connecticut, and Indiana,[8] the overwhelming majority of debtors were filing under chapter 7 of the Bankruptcy Code[9]—the quicker and cheaper consumer chapter that provides the majority of bankruptcy debtors the relief they need. Under chapter 7, debtors liquidate all of their nonexempt property and receive a discharge of most unsecured debts.[10] The liquidation requirement has little bite because very few chapter 7 filers have unencumbered, nonexempt assets that a bankruptcy trustee can sell to pay creditors.[11] Most chapter 7 debtors receive their discharge within a few months.[12]
In other areas of the country, such as Alabama and the Western District of Tennessee, most debtors were filing under chapter 13,[13] which requires debtors to pay all of their disposable income over a period of three to five years.[14] Chapter 13 does provide tools for some consumers trying to save their homes[15] and a broader discharge than chapter 7 (although Congress has narrowed this discharge since the time of the original CBP research).[16] Still, the differences in chapter 7 and chapter 13 were highly improbable sources for the huge variation in chapter choice bankruptcy scholars observed around the country.
Although the Bankruptcy Code leaves the decision of which chapter to use mostly in the debtor’s hands,[17] the scholars argued that the results of this
choice and other choices[18] were, in fact, driven by local legal culture. As Professor Westbrook explained:
The evidence strongly suggests that the “choices” given to debtors are often exercised in fact by creditors, lawyers, by judges through lawyers, and by judges through debtors. The average consumer debtor, faced with an extraordinarily complex statute at a moment of financial and personal crisis, will be guided by lawyers and pressures exerted through lawyers.[19]
Sullivan, Warren, and Westbrook identified local legal culture as “systematic and persistent variations in local legal practices” that arose because of “perceptions and expectations shared by many practitioners and officials in a particular locality.”[20] Persistence over time was a key feature of their conceptualization, and their foundational article on the topic examined local culture features that persisted across 1970, 1980, and 1990.[21] Braucher similarly defined local legal culture as the “context created by” a locality’s “administrative practices of judges and trustees, and prevailing professional attitudes,”[22] although she did not emphasize persistence. The CBP researchers and Braucher each used qualitative data to develop portraits of the complex interactions among judges, trustees, and debtor attorneys that shaped local legal culture.[23]
Authors working with the databases from the CBP since that time have produced findings on local legal culture, but the focus has shifted to race. Specifically, beginning with the 1991 CBP, researchers documented a disturbing trend. Black debtors, and sometimes Latino debtors, were overrepresented in chapter 13, the chapter that takes more time,[24] costs more money,[25] and has a significantly lower discharge rate.[26] These patterns remained even when controlling for income, homeownership, and a variety of other factors associated with chapter 13.[27] Research from the 2007 CBP additionally controlled for judicial district and found that the correlations between chapter 13 and black debtors remained significant.[28] An article based on the 2007 and 2013–2015 CBPs found that judicial districts with high chapter 13 rates significantly correlated with the overrepresentation of black debtors in chapter 13—and that the effect of judicial district became more pronounced once researchers controlled for debtor financial variables associated with chapter 13.[29]
The current study adds to this recent work with new methods. Using a public database collected by the Administrative Office of the U.S. Courts, we analyzed chapter choice in consumer bankruptcies filed from fiscal years 2012–2016.[30] We developed three sets of factors expected to influence chapter choice in a consumer bankruptcy case: (1) case characteristics, particularly features of the debtor’s economic situation that make chapter 7 or 13 more appropriate; (2) a debtor’s geographic community based on demographics of her zip code; and (3) judicial district. We analyzed both geographic community and legal district to shed light on an ambiguity in the scholarship of local legal culture—what does “local” mean? Is it the debtor’s neighborhood or the debtor’s legal neighborhood that counts?
Our results support and extend the prior research. Race, once again, matters. More specifically, race, case characteristics, and judicial district are the only variables that matter. We find that case characteristics are significantly associated with each bankruptcy chapter in the expected ways. For example, real property correlates with chapter 13, almost certainly because of the tools chapter 13 provides for saving debtors’ homes.[31] Unsecured debt correlates with chapter 7, which provides a more effective mechanism for discharging it.[32] At the community level, the most interesting point is what we do not find. Although most of the community variables we tested are statistically significant when the regression includes only case and community variables, once we add judicial district to the regression, the only variable that retains its statistical significance is race, specifically the percentage of the debtor’s zip code that is black. The disappearance of significance for most of the community variables once we add district fixed effects suggests that the “work” of local legal culture is being done at the legal level rather than at the community level. Finally, most judicial districts in the United States are statistically significant at a very high level. The pattern we find among judicial district chapter 13 rates both confirms and complicates the conventional wisdom of chapter 13 as a southern phenomenon.
This Article makes several contributions. First, we use observational data on the universe of bankruptcy filers. All of the recent CBPs are surveys of a national random sample, which means that participation in them is voluntary. Thus, researchers using the CBP data could never rule out nonresponse bias, the possibility that study participants somehow differed from debtors who chose not to participate.[33] Second, although the prior research, especially that of the early CBP and Braucher, leaves little doubt that local legal culture exists, the phrase contains ambiguities. This study considers competing definitions of “local” and thus provides quantitative evidence suggesting that legal boundaries may be more relevant than geographic ones. Third, our finding that race is the only community-level variable that retains significance when we add judicial districts to the regression provokes more questions than it addresses. This unsettling result, combined with the importance of judicial districts, suggests directions for future research. Legal professionals and their attitudes need further examination. A return to the qualitative methods of Braucher and the early CBP may be a particularly fruitful line of inquiry.
The rest of this Article proceeds as follows. Part II is a literature review. Part III provides our methodology, results, and interpretation of findings. Part IV concludes with more directions for future research.
II. Literature Review
A. What Is Local Legal Culture? Definitions and Origins in the Literature
The first study to probe local legal culture, although it did not use the term, was Stanley and Girth’s seminal Brookings Institution study. They found wide variation in chapter XIII rates—the predecessor to chapter 13—among the seven districts they studied.[34] Chapter XIII cases ranged from 76% of all filings in the Northern District of Alabama to 52% in Maine to 11% or fewer in four districts.[35] Their “unit of locality” was district, but they did not study any districts within the same state,[36] limiting their ability to identify judicial district or state as the level of locality for the effect.
Sullivan, Warren, and Westbrook began to fill this gap by examining the variation between judicial districts within the same state, using survey and court-record data from ten judicial districts studied in the CBP. They argued that because bankruptcy is federal law and incorporates some state law, variations between districts within a state that persist over time must be due to local culture.[37] Their examination of chapter choice found tremendous variation between states as well as judicial districts within states. For example, 20% of the filings in the Southern District of Alabama were chapter 13 cases compared to 66% in the Middle District of Alabama.[38] Moreover, the authors found statistically significant persistence in the district rates over time.[39]
Sullivan, Warren, and Westbrook argued that the complex and numerous decisions that went into a bankruptcy case made the consumer bankruptcy system particularly susceptible to the development of local legal cultures.[40] They also argued that influential individuals in a legal community changed over time and thus were an unlikely source for their findings about patterns that had held up over twenty years.[41]
Braucher studied four bankruptcy divisions[42] from two pairs of cities that shared a federal judicial district.[43] The two pairs of cities were in two parts of the country—Ohio and Texas—that had distinct chapter 13 rates.[44] Braucher demonstrated the existence of local legal culture through in-depth qualitative interviews with legal professionals.[45] She showed how judges and especially trustees shaped local legal culture by imposing requirements not in the Bankruptcy Code and incentivizing attorneys to use chapter 7 or chapter 13.[46] She also analyzed the complex interactions among the incentives of attorneys and their clients that led to the use of one bankruptcy chapter or another.[47]
Taken together, the Sullivan, Warren, and Westbrook and Braucher studies left little doubt that many local legal cultures existed in the bankruptcy system. Using different research methods, two sets of scholars had come to the same fundamental conclusions about the existence and nature of the local legal cultures. The idea was on the scholarly map, and many scholars both replicated and expanded their findings.
Using data from the Administrative Office of the U.S. Courts (AO), Whitford showed wide variation in chapter 13 rates among judicial districts in 1990, 1992, and 1993.[48] Whitford later updated these findings using 1993, 2002, 2009, and 2010 data, suggesting that the percentage of chapter 13 cases in each district had remained relatively consistent across these four years.[49] Bermant, Flynn, and Bakewell drilled down to divisions as the unit of locality. They used 2001 AO data to demonstrate that state chapter 13 rates masked variations among districts and that district chapter 13 rates masked variation among divisions.[50] Norberg and Schreiber Compo found widespread disparities in chapter 13 rates among seven judicial districts in the South and mid-Atlantic regions and that the high-chapter 13 districts tended to have fewer chapter 13 debtors with mortgages than the other districts, suggesting that debtors without mortgages were filing under chapter 13 in the former districts due to local legal culture.[51] Ondersma replicated Sullivan, Warren, and Westbrook’s analysis of the persistence of local legal culture with an expanded dataset that included data on exemption laws, poverty and unemployment rates, and foreclosure rates, none of which could explain the variation of chapter 13 choice across localities.[52]
B. Race and Ethnicity
The concept of “local legal culture” was at the same time both pathbreaking and incomplete. As one of this Article’s authors put it:
“Local” is a problem because it is generally taken to mean areas defined by political boundaries . . . rather than boundaries that are psychologically meaningful to people. “Legal” is a problem because the cultural values we discuss may be a product of broad community sentiment, rather than ones unique to the local legal community. “Culture” is a problem because . . . we have no measures of the attitudes, values, and beliefs of professionals in the legal system. On the other hand, the advantage of the present definition is that it fits with a common conception of the term that many people have—local legal culture is what the people in a local legal community “do”; it is their practices that define them.[53]
Thus, scholars needed to and did start to unpack the constituent parts of what made for a “culture” that was both “local” and “legal.” The most widely known of these efforts have focused on racial and ethnic differences in who files chapter 13. In her original study, Braucher noted that Ohio standing trustees were concerned that black debtors were overrepresented in chapter 13, with one stating that black debtors were possibly “being taken advantage of.”[54]
The earliest efforts appeared either as byproducts of research with other goals or based on nonrandom samples that limited statistical inference. In a paper about the rise of filings after the 1978 implementation of the Bankruptcy Code, White found that the percentage of African-American debtors in a county’s population was associated with a statistically significant increase in the proportion of chapter 13 cases.[55] Interestingly, she found no statistically significant relationship between African-Americans and chapter 7 filings, but the proportion of Spanish-speaking debtors in a county was significantly negatively associated with chapter 7 filings.[56]
Using data from the 1991 CBP, Chapman found that although African-Americans appeared to be overrepresented in consumer bankruptcy, they were not overrepresented in chapter 7, which implied that they were overrepresented in chapter 13.[57] Specifically, his data analysis found that non-Hispanic whites were statistically significantly more likely to file under chapter 7 than other racial and ethnic groups.[58] Chapman found that this effect was uniform in all but one of the studied districts that yielded data appropriate for his analysis.[59] Van Loo used data from the 2001 CBP to find 61.8% of black debtors used chapter 13 compared to 29.4% of Hispanic and 20.5% of white debtors.[60] After controlling for the influence of income, education, and employment, he found that only 19.8% of blacks and 19.4% of Hispanics in chapter 13 obtained a discharge compared to 28.3% of non-Hispanic whites.[61] Van Loo attributed the lower discharge rates to more aggressive uses of motions to dismiss in the chapter 13s of black debtors as compared to debtors of other races.[62] Although doing more extensive data analysis than the previous articles, the Chapman and Van Loo studies relied on earlier iterations of the CBP that were not national random samples, limiting the statistical inferences that could be drawn.
Using CBP data from 2007 that was collected from a national random sample, Braucher, Cohen, and Lawless found that blacks were disproportionately likely to file under chapter 13.[63] This effect held even when controlling for twenty variables that theoretically should determine a filing under chapter 13 including: home ownership, pending foreclosure, legal representation, monthly income, asset levels, total debt, priority debt, the percentage of debt that was secured or credit card debt, and demographic variables such as marital status and education. The study also developed a control variable that effectively isolated the effects of geography from those of race, and yet race was still a statistically significant determinant in chapter choice.[64] Even after controlling for the variables that should determine chapter choice, blacks were roughly twice as likely to file chapter 13 as debtors of other races. The authors also found that blacks did not receive more favorable treatment in chapter 13 and were indeed slightly more likely to have their cases dismissed. In articles for a symposium discussing this paper, Doherty[65] and Eisenberg[66] reanalyzed the authors’ data and confirmed their findings.
The same Braucher, Cohen, and Lawless paper also included an experimental vignette that asked consumer bankruptcy attorneys to select a bankruptcy chapter for a hypothetical couple with a mix of financial characteristics that could suggest chapter 7 or 13.[67] The only variations were the race of the couple (white, black, no race identified) and the couple’s expressed chapter preference (chapter 7, chapter 13, no preference).[68] Attorneys who thought they were counseling a black couple were about twice as likely to recommend chapter 13 as attorneys who thought they were counseling a white couple.[69] Attorneys were less likely to say that a black couple who wanted chapter 7 were persons of “good values” or were “competent” but had directly the opposite reaction to a white couple who wanted chapter 7.[70]
Greene, Patel, and Porter found that the debtor’s race had a major impact on chapter 13 plan completion.[71] Using data from the 2007 CBP, they found black debtors were 17% less likely to receive a discharge than their non-black counterparts when controlling for all the other statistically significant variables in the study.[72] The authors concluded: “More than amount of debt, prior bankruptcies, trying to save a home from foreclosure, or having a job—all features that are imbedded in chapter 13 of the Bankruptcy Code—race matters.”[73]
Using a sample from Cook County, Illinois, Morrison and Uettwiller found many of the same racial pathologies that other researchers have documented.[74] But they provided a new possible explanation for the high chapter 13 rates and poor chapter 13 outcomes among black debtors—parking tickets and related government fines, which are dischargeable in chapter 13 but not chapter 7.[75] Blacks were overrepresented among bankrupt debtors with more than $500 in fines, the group of filers that had the highest termination rates. Within this group, blacks and debtors of other races had similar chances of having their cases terminated.[76] Moreover, when the authors excluded the “fines” group from the population of bankruptcy filers, blacks remained disproportionately represented but at smaller rates.[77] Morrison and Uettwiller suggest that government fines may be driving the chapter 13 racial disparities in Cook County because African-Americans appear to be particularly vulnerable to receiving these fines, and debtors within the “fines” group have low incomes that make it challenging to complete chapter 13 plans.[78]
Foohey, Lawless, Porter, and Thorne have found blacks disproportionately represented among so-called “no money down” chapter 13s, where the entire attorney’s fee is funded through the chapter 13 plan. Indeed, the largest determinants of a no-money-down chapter 13 are the judicial district where the case is filed and the race of the debtor. Using data from the 2007 and 2013–2015 CBPs, they found that the financial characteristics of debtors filing no-money-down chapter 13 cases resembled those of chapter 7 debtors more than those of debtors filing “traditional chapter 13s.”[79] They tied these findings to local legal culture by demonstrating that, when controlling for other relevant factors, the higher the chapter 13 rate in a district, the higher the use of no-money-down plans and the higher the racial difference in chapter use.[80] In fact, much of the racial disparity in chapter use in high-chapter 13 districts may be accounted for by no-money-down cases.
In an article for ProPublica, Kiel and Fresques used AO data supplemented by demographic data via zip codes to find that nationally the odds of filing under chapter 13 were twice as high for debtors living in a mostly black area.[81] Compared to black debtors who filed under chapter 7, the black chapter 13 debtors had less income, fewer assets, lower secured debts, and dramatically lower unsecured debts.[82] The authors did an in-depth study on two districts with especially troubling disparities—the Northern District of Illinois and the Western District of Tennessee.[83] In both districts, Kiel and Fresques found that a handful of law firms accounted for a significant number of all chapter 13 filings, and, at least in Tennessee, the practice “nearly always” was to file with no money down. Like Morrison and Uettwiller, Kiel and Fresques found many black debtors were filing under chapter 13 to avoid suspension of their driver’s licenses.[84]
Most recently, Cohen, Lawless, and Shin replicated the 2007 CBP findings about racial disparities in chapter use with 2013–2015 data from the current CBP.[85] Further, the authors surveyed a national random sample of consumer bankruptcy attorneys and found that their beliefs about the percentage of African-Americans and whites who filed under chapter 13 was exactly reversed from the real-world percentages.[86] On average, attorneys believed that whites were more than twice as likely to file under chapter 13 as African-Americans when in fact the opposite is true.[87]
III. Data and Analysis
A. Methodology
Our theory conceptualizes the chapter choice decision as being the result of three different dynamics: (1) the individual debtor’s circumstances; (2) the community from where the debtor comes; and (3) the legal norms and rules of the debtor’s judicial district. The first idea captures traditional explanations for chapter choice, such as the idea that homeowners will be more likely to file chapter 13 because it offers greater protections to homeowners than chapter 7. Because these determinants are individual to the debtor, they would not represent a “local culture.” The second idea is that certain communities may offer financially distressed debtors fewer options or constrain debtors’ bankruptcy choices. Given the previous findings, the racial composition of a community may be a particularly important factor. The third idea is that the legal professionals—lawyers, trustees, and judges—implement formal rules or have informal norms that direct bankruptcy debtors to a particular chapter choice.
Our data came from the Integrated Database assembled by the AO and made available through the Federal Judicial Center.[88] Specifically, we used the “Bankruptcy Snapshot 5-year File” for the governmental fiscal years 2012–2016.[89] This file contains all bankruptcy cases filed, pending, or terminated at any point from October 1, 2011 to September 30, 2017; although, we only used cases filed on January 1, 2012, and after. The database contains (1) much of the information found in the bankruptcy petition—such as chapter choice, legal representation, method of paying filing fees, debtor’s zip code, case status (pending/dismissed)—and (2) the information found in the summary of schedules on asset, debt, income, and expense levels.[90]
It is possible for a case to appear more than once in the database if it is pending for more than one year. The full database contains 12,502,973 records of 6,675,597 unique bankruptcy cases. Because we are interested in the filing decision for chapter 7 and chapter 13, we used the case record from the year of filing. We further eliminated (1) cases filed outside the fifty states and the District of Columbia; (2) records representing a reopened case; (3) cases where the debtor’s bankruptcy petition identified the debts as predominately business in nature; (4) cases filed by nonindividuals; and (5) cases filed by persons who were not U.S. residents. Our final database had 4,343,794 unique bankruptcy cases filed from fiscal year 2012–2016.
We then downloaded zip-code level data using the U.S. Census Bureau’s American FactFinder website.[91] The American Community Survey (ACS)[92] provided data on population by race, Hispanic/Latino origin, owner- vs. renter-occupied housing units, and income. We used ACS five-year estimates for the years 2012–2016, exactly overlapping with our bankruptcy data.
The U.S. Census Bureau’s County Business Patterns[93] series provided zip-code level data on consumer-lending storefronts as a measure of constrained financial advice and lending within a community. We used the 2014 data from this series because that year is the midpoint of our bankruptcy database. Consistent with Bhutta,[94] we downloaded the count of establishments identified in two North American Industry Classification System (NAICS) codes:[95]
- 522390 Other Activities Related to Credit Intermediation: This code provides information on services such as “Check cashing services, Money order issuance services, Loan servicing, Travelers’ check issuance services, Money transmission services, Payday lending services.”
- 522291 Consumer Lending: This code provides information on “establishments primarily engaged in making unsecured cash loans to consumers. Illustrative Examples: Finance companies (i.e., unsecured cash loans), Personal credit institutions (i.e., unsecured cash loans), Loan companies (i.e., consumer, personal, student, small), Student loan companies.”
For a shorthand reference, we call the sum of these counts “fringe lending,” although the term is overinclusive. We used the zip-code level population counts from the ACS to construct a measure of fringe lending storefronts per 1,000 residents in the zip code.
We merged the zip-code level data from the U.S. Census with the bankruptcy database using the zip code for the first debtor listed in the bankruptcy petition. This method has two complications. First, the ACS uses zip-code tabulation areas (ZCTAs), which in most instances are identical to the corresponding zip code, but ZCTAs can sometimes diverge from exact contiguity with a zip code depending on where census tract boundaries fall. Second, in 2.9% of the joint cases, the second debtor listed a zip code different from the first debtor. As a robustness check, we reran our regressions omitting these cases, and the results did not change.
B. Results
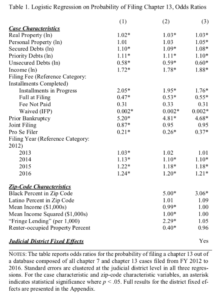
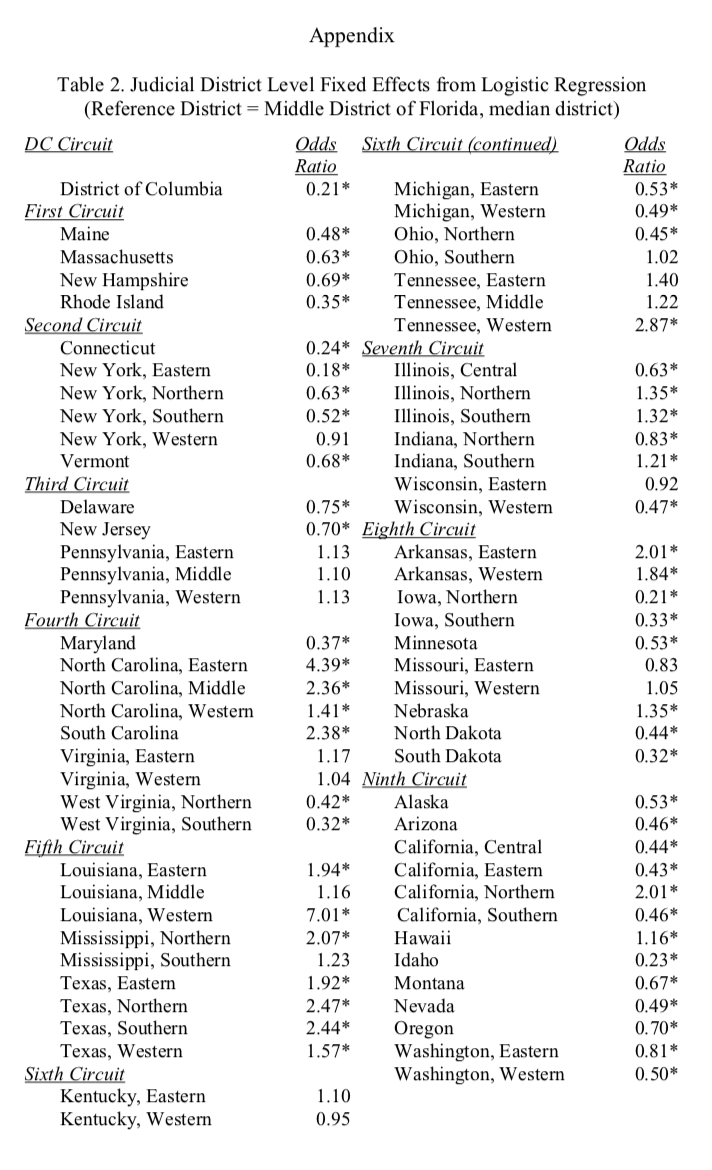
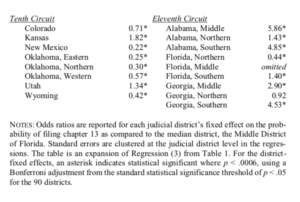
To test our theories, we constructed a series of regressions on the determinants of the bankruptcy chapter choice between chapter 7 and chapter 13. Because the outcome is a binary variable, we ran a logistic regression, and for ease of interpretation we report odds ratios. The odds ratio can be interpreted as the effect of the variable on the probability of filing chapter 13. Table 1 reports the regression results with an expanded table of the odds ratios for the fixed effects of each judicial district appearing in the Appendix.
The first regression captures case characteristics. The second regression adds zip-code level data as our measure of the debtor’s community. The final regression then adds fixed effects for each judicial district. Our measures are not perfectly mutually exclusive. For example, the racial composition of a neighborhood tells us something both about the probability of the debtor’s race and perhaps the socioeconomic status of the neighborhood.
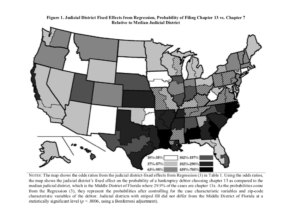
Finally, we created a map (Figure 1) grouping the judicial districts into six clusters based on the final regression. The map reports the odds ratio and thus can be interpreted as the probability of observing a chapter 13 filing in each district as compared to the median district, the Middle District of Florida, after controlling for the variables in the regression. The map provides a visual overview of the wide variation in chapter 13 use across the country and within many states as well as the regional clustering of many of the high-chapter 13 districts.
C. Discussion
The most striking finding is that, at the zip-code level, the only variable that matters consistently is the zip code’s racial composition. At the case level, the characteristics that one would expect to drive chapter 13 filings are in fact associated with chapter 13 cases. Chapter 13 is more likely with higher amounts of real property, secured debts, priority debts, unsecured debts, and income, as well as paying the filing fee in installments, prior bankruptcy, and retaining an attorney. Higher amounts of real property, secured debt, and priority debt are likely to make chapter 13 attractive to debtors because that chapter provides tools for managing real estate and those debts.[96] A higher income increases a debtor’s ability to propose and complete a feasible chapter 13 plan.[97] Chapter 13 is associated with debtors paying legal fees in installments,[98] so the chapter’s correlation with debtors paying filing fees in installments is not surprising. Prior bankruptcy is strongly associated with chapter 13, partly because debtors face longer waiting periods after an earlier discharge to file again under chapter 7 than under chapter 13.[99] In addition, chapter 13 debtors who drop out prior to discharge because they cannot afford the payments often try again later.[100] Finally, given the greater complexity of chapter 13 and the dismal track record of pro se filers in confirming chapter 13 plans,[101] it makes sense that being represented is positively associated with filing chapter 13.
But once we move to the zip-code level, the logical connection between chapter 13 and factors associated with it becomes more complex. We tested zip-code income, Latino percentage of the zip code, black percentage of the zip code, fringe lending, and percentage of zip-code housing that is rental units. The fringe-lending variable examines the effects of living in lower-quality neighborhoods. Because we used racial percentages in zip codes as a proxy for race, we needed to consider the possibility that black neighborhoods were associated with chapter 13 rather than black debtors. African-Americans tend to live in poorer-quality neighborhoods due to decades of housing discrimination during and after the Jim Crow Era.[102] Zip-code percentage of housing that is rented was another proxy for neighborhood quality, but this variable’s inclusion also reflects our thinking that homeowners are more likely to file under chapter 13. At the zip-code level, both of these variables were significant. Fringe lending was positively associated with chapter 13. When interpreting that result, it is important to note that most zip codes have zero or one fringe lender per thousand residents, with more than half of zip codes having no fringe lenders. So the odds ratio of 2.21 means that the difference between having zero and one fringe lender per thousand people in a zip code is a 221% increase in the likelihood of a debtor in that zip code filing under chapter 13. Percentage of property in a zip code that was renter-occupied is negatively correlated with chapter 13, supporting the classic association of chapter 13 with homeowners. Income was negatively correlated with chapter 13, which is surprising because it was positively correlated with chapter 13 at the case level. Reconciling the findings suggests that, all else equal, an increase in an individual debtor’s income is an indicator of chapter 13, while a decrease in zip-code income is an indicator of chapter 13. The latter result supports Kiel and Fresques’ counterintuitive finding that, in high-chapter 13 districts, lower incomes were associated with chapter 13.[103]
The only variable that was not significant at the zip-code level was Latino percentage. On one hand, this result is surprising. Like African-Americans, Latinos experience lending discrimination,[104] so we might expect them to be steered into chapter 13 the way that black debtors appear to be.[105] And the analyses of data from early CBPs identified Latino as well as black disparities in chapter use[106] and case outcomes.[107] In addition, Puerto Rico has a long-standing history as a high-chapter 13 district,[108] which may result from some of the same implicit racial associations found with respect to blacks in the attorney-vignette study.[109] On the other hand, neither of the two most recent CBP studies found a Latino effect,[110] and this study’s lack of Latino findings supports those results.
More interesting than the significance of income, fringe lending, and rental housing at the zip-code level is the fact that none of these variables retain their significance once we control for judicial district by adding fixed effects in the third regression. Our database contained the universe of over 4.3 million bankruptcy filings in the study period. Although we are cautious to interpret from a null result, we believe our finding suggests that the geographic pattern of chapter use is being determined by legal boundaries rather than neighborhood boundaries.
The one variable that remains significant even when controlling for district fixed effects is the black percentage in a zip code. It is positively correlated with the chapter 13 rate, and the effect is strong. The difference between a debtor living in a zip code that is 0% black and 100% black is a 306% increase in likelihood of that debtor filing under chapter 13.[111] Of course, we cannot rule out the possibility that debtors of other races living in predominantly black zip codes also have high odds of filing under chapter 13. There could be unobserved characteristics of black neighborhoods that are associated with chapter 13. Our attempts to control for neighborhood quality provide some evidence that neighborhoods are not the issue but cannot fully address this concern.
Prior studies also give us more confidence that our racial finding is hardly spurious. The 1991, 2001, 2007, and current iterations of the CBP all found racial disparities in chapter use,[112] and this study provides important support for these findings. However, all of these CBPs were surveys and are thus subject to the critique of nonresponse bias.[113] A major contribution of this study is to provide support for the racial disparities found by the CBP using data that did not require voluntary participation by respondents.
While the most important characteristic of the results of adding the district fixed effects is the effect that the addition has on other variables, the distribution of chapter 13 filings among judicial districts also sheds light on the relationship between chapter 13 and the South. The South has been viewed as the chapter 13 belt since at least 2002.[114] As Figure 1 shows, our results support this finding in interesting ways. First, the South appears to be committed to chapter 13. With the exception of Kansas, all of the states that have a majority of districts in the top two chapter 13 clusters were part of the Confederacy during the U.S. Civil War.[115] Conversely, Florida is the only former Confederate state that does not have a majority of districts with greater-than-median chapter 13 filing rates, although several Southern districts have chapter 13 rates that are not significantly different from that of the reference, median district, the Middle District of Florida. On the other hand, there are several high-chapter 13 districts in other parts of the country, such as the Northern District of California, the District of Kansas, and the District of Utah. However, most of the non-Southern states with high chapter 13 rates have districts that fall in the third-highest cluster, meaning that their chapter 13 percentages are 102% to 157% greater than the reference district. And none of these states have any districts in the highest cluster, with chapter 13 rates that are 439% to 703% greater than those in the Middle District of Florida.
This map also sheds interesting light on Sullivan, Warren, and Westbrook’s original findings. The 1981 CBP covered three states: Illinois, Pennsylvania, and Texas.[116] Illinois and Pennsylvania have turned out to be two of the non-Southern states that contain above-median chapter 13 districts. This may have made it more difficult to notice the concentration of the chapter 13 belt in the South until relatively recently.
IV. Conclusion
Our research builds on and extends prior studies. We confirmed CBP findings on race and chapter choice with a non-survey database. Specifically, we found that race and judicial district appear to be the key factors in chapter choice beyond the economic profile of a bankruptcy case. We began to address the question of whether the “local” in “local legal culture” is shaped by legal geography or general geography. Our findings suggest that legal boundaries are playing a more important role.
This study also points to directions for future research. We obtained one finding on the meaning of “local” in “local legal culture.” Additional research would make the relationship between “local” and “legal” clearer. For example, it could examine places where zip codes span more than one judicial district to see if the changes in chapter 13 rate are occurring at the zip-code or district boundaries. Already, our finding on the meaning of “local” suggests the need to explore the roles of professionals more deeply. One possibility is to examine law-firm patterns in districts with varying chapter 13 rates. Kiel and Fresques’s study of Tennessee suggests that law-firm concentration may be playing a role in the relationship between race and chapter 13.[117] Finally, this study points in the direction of returning to the methods of Sullivan, Warren, and Westbrook and Braucher’s original scholarship on local legal culture by supplementing big data with in-depth qualitative research with judges, lawyers, trustees, and other bankruptcy actors.
- .Telephone Interview with Professor Jay Lawrence Westbrook, Benno C. Schmidt Chair of Business Law, Univ. of Tex. Sch. of Law (Jan. 20, 2018). ↑
- .That said, we both believe in the value of researchers leaving their offices to interact with the systems they are studying and to generate their own data. Lawless is a coprincipal investigator on the current CBP, which gathers court-record data and surveys consumer bankruptcy filers on an ongoing basis. See, e.g., Pamela Foohey, Robert M. Lawless, Katherine Porter & Deborah Thorne, “No Money Down” Bankruptcy, 90 S. Cal. L. Rev. 1055, 1071 (2017) (analyzing data from the 2007 and 2013–2015 CBP). Littwin has collected qualitative and quantitative data for analysis in recent years. See, e.g., Angela Littwin, Adapting to BAPCPA, 90 Am. Bankr. L.J. 183, 189 (2016) (reporting data from fifty-three interviews with consumer bankruptcy attorneys); Angela Littwin with Adrienne Adams & McKenzie Javorka, The Frequency, Nature, and Effects of Coerced Debt Among a National Sample of Women Seeking Help for Intimate Partner Violence, Violence Against Women (forthcoming 2020). We are both nonetheless glad that we did not have to carry a copy machine up three flights of stairs. ↑
- .Teresa A. Sullivan, Elizabeth Warren & Jay Lawrence Westbrook, The Fragile Middle Class: Americans in Debt 238–52 (2000). ↑
- .Id. at 73–74. ↑
- .Teresa A. Sullivan, Elizabeth Warren & Jay Lawrence Westbrook, As We Forgive Our Debtors: Bankruptcy and Consumer Credit in America 17, 217 (1989) (reporting that only one-third of chapter 13 debtors in their database completed their bankruptcy plans). ↑
- .Jean Braucher, Lawyers and Consumer Bankruptcy: One Code, Many Cultures, 67 Am. Bankr. L.J. 501, 503 (1993). ↑
- .Teresa A. Sullivan, Elizabeth Warren & Jay Lawrence Westbrook, The Persistence of Local Legal Culture: Twenty Years of Evidence from the Federal Bankruptcy Courts, 17 Harv. J.L. & Pub. Pol’y 801, 810–11 (1994). The Bankruptcy Code also incorporates some elements of state law, most notably state exemption law. 11 U.S.C. § 522(b) (2012). But the researchers found a wide variety of practices within states, which suggested that state law could not be driving regional differences. Sullivan et al., supra note 7, at 828–29; Braucher, supra note 6, at 515–16. ↑
- .Sullivan et al., supra note 7, at 825 tbl.3. ↑
- .11 U.S.C. §§ 701–27 (2012). ↑
- .Id. §§ 523, 727. ↑
- .Dalié Jiménez, The Distribution of Assets in Consumer Chapter 7 Bankruptcy Cases, 83 Am. Bankr. L.J. 795, 797 (2009); Lois R. Lopica, Am. Bankr. Inst. Nat’l Conference of Bankr. Judges, The Consumer Bankruptcy Creditor Distribution Study 6, 44–45 (2013). ↑
- .Dov Cohen & Robert M. Lawless, Less Forgiven: Race and Chapter 13 Bankruptcy, in BROKE: How Debt Bankrupts the Middle Class 175, 175 (Katherine Porter ed., 2012); Katherine Porter, The Pretend Solution: An Empirical Study of Bankruptcy Outcomes, 90 Texas L. Rev. 103, 116 (2011). ↑
- .Sullivan et al., supra note 7, at 825–26 tbl.3. Consumers may also file under chapter 11, but only a tiny percentage of consumer debtors use this option. See Admin. Office of the U.S. Courts, Caseload Statistics Data Tables, http://www.uscourts.gov/statistics-reports/ caseload-statistics-data-tables [https://perma.cc/4AN2-2LMN] (showing statistically that a minimal number of nonbusiness filings fall under chapter 11 while the majority fall under chapter 7 and chapter 13). ↑
- .11 U.S.C. § 1325(b)(4) (2012). ↑
- .Id. § 1322(b)(5), (c). ↑
- .Id. § 1328(a)(2) (incorporating some but not all of the nondischargeability provisions in § 523(a)). ↑
- .In 2005, Congress added the means test to prevent high-income debtors from filing under chapter 7. Bankruptcy Abuse Prevention and Consumer Protection Act of 2005, Pub. L. No. 109‑8, § 102(h), 119 Stat. 23, 33–34 (2005). The change appears to have had little effect on the ratio of chapter 7 to chapter 13 filings. Chrystin Ondersma, Are Debtors Rational Actors? An Experiment, 13 Lewis & Clark L. Rev. 279, 295–303 (2009). ↑
- .Bankruptcy chapter is not the only debtor choice guided by local legal culture. Sullivan, Warren, and Westbrook also studied filing rates and proposed payments to creditors in chapter 13 plans. Sullivan et al., supra note 7, at 811. Braucher additionally studied repayment rates in chapter 13 cases. Braucher, supra note 6, at 530–34. We focus on chapter choice in this Article for two reasons. First, once a debtor decides to file for bankruptcy, the choice of chapter influences—and frequently determines the outcome of—the other choices in the case. Second, most of the recent research on local legal culture has focused on chapter choice because of the disturbing racial trends associated with that decision. See infra subpart II(B). ↑
- .Jay Lawrence Westbrook, Local Legal Culture and the Fear of Abuse, 6 Am. Bankr. Inst. L. Rev. 25, 30 (1998). ↑
- .Sullivan et al., supra note 7, at 804. ↑
- .See generally Sullivan et al., supra note 7. ↑
- .Braucher, supra note 6, at 503. ↑
- .See infra subpart II(A). ↑
- .See supra Part I. ↑
- .Lois R. Lupica, The Consumer Bankruptcy Fee Study: Final Report, 20 Am. Bankr. Inst. L. Rev. 17, 58 fig.4, 69 fig.7 (2012). ↑
- .Sullivan et al., supra note 5, at 222; Sara S. Greene, Parina Patel & Katherine Porter, Cracking the Code: An Empirical Analysis of Consumer Bankruptcy Outcomes, 101 Minn. L. Rev. 1031, 1042 (2017). ↑
- .See infra Part II. ↑
- .Cohen & Lawless, supra note 12, at 185. ↑
- .Foohey et al., supra note 2, at 1088. ↑
- .See infra subpart III(A). ↑
- .See 11 U.S.C. § 1322(b)(5) (2012) (providing an option to cure a mortgage in default). ↑
- .Foohey et al., supra note 2, at 1093 tbl.5. ↑
- .Jean Braucher, Dov Cohen & Robert M. Lawless, Race, Attorney Influence, and Bankruptcy Chapter Choice, 9 J. Empirical Legal Stud. 393, 423–24 (2012). ↑
- .David T. Stanley & Marjorie Girth, Bankruptcy: Problem, Process, Reform 74–75 (Brookings Inst. ed., 1971). ↑
- .Id. at 74. ↑
- .See id. at 41–42 (studying districts of Northern Ohio, Northern Alabama, Maine, Northern Illinois, Oregon, Western Texas, Southern California, and Southern New York). ↑
- .Sullivan et al., supra note 7, at 812. ↑
- .Id. at 828. ↑
- .Id. at 829–30 (basing this finding on data from the Administrative Office of the U.S. Courts covering 1970, 1980, and 1990). ↑
- .Id. at 836–39. ↑
- .Id. at 839. ↑
- .A division is a subunit within a judicial district. See, e.g., 28 U.S.C. § 124 (2000) (dividing the Northern District of Texas into seven divisions). ↑
- .Braucher, supra note 6, at 515. ↑
- .Id. ↑
- .Id. at 512–13. ↑
- .See, e.g., id. at 546–47 (finding that, while consumer attorneys earned higher fees for chapter 13 cases than chapter 7s in all four divisions, the divisions with higher chapter 13 rates featured larger differences in the amount by which the attorney fees for a chapter 13 exceeded those for a chapter 7 case). ↑
- .Id. at 562–63. ↑
- .William C. Whitford, The Ideal of Individualized Justice: Consumer Bankruptcy as Consumer Protection, and Consumer Protection in Consumer Bankruptcy, 68 Am. Bankr. L.J. 397, 411–14 (1994). ↑
- .William C. Whitford, Small Ball, 90 Texas L. Rev. See Also 9 app. A (2011). ↑
- .Gordon Bermant, Ed Flynn & Karen Bakewell, Bankruptcy by the Numbers: Thoughts on the “Local Legal Culture”, Am. Bankr. Inst. J., Feb. 2002, at 24, 24. ↑
- .Scott F. Norberg & Nadja Schreiber Compo, Report on an Empirical Study of District Variations, and the Roles of Judges, Trustees and Debtors’ Attorneys in Chapter 13 Bankruptcy Cases, 81 Am. Bankr. L.J. 431, 436–37 (2007). ↑
- .Ondersma, supra note 17, at 303–05. ↑
- .Cohen & Lawless, supra note 12, at 180. ↑
- .Braucher, supra note 6, at 559–60. ↑
- .Michelle J. White, Personal Bankruptcy Under the 1978 Bankruptcy Code: An Economic Analysis, 63 Ind. L.J. 1, 48 (1987). ↑
- .Id. at 47. ↑
- .Robert B. Chapman, Missing Persons: Social Science and Accounting for Race, Gender, Class, and Marriage in Bankruptcy, 76 Am. Bankr. L.J. 347, 387 n.226 (2002). ↑
- .Id. ↑
- .Id. ↑
- .Rory Van Loo, A Tale of Two Debtors: Bankruptcy Disparities by Race, 72 Alb. L. Rev. 231, 234 (2009). ↑
- .Id. ↑
- .Id. at 237. He was not able to analyze Hispanic debtors because the sample of those receiving a discharge was too small. He limited this analysis to discharged debtors because almost all of the debtors with dismissed cases were subject to motions to dismiss. Id. at n.28. ↑
- .Braucher et al., supra note 33, at 400–04. ↑
- .Id. at 403; see also Cohen & Lawless, supra note 12, at 186–87 (reporting an earlier version of the study). ↑
- .Joseph W. Doherty, One Client, Different Races: Estimating Racial Disparity in Chapter Choice Using Matched Pairs of Debtors, 20 Am. Bankr. Inst. L. Rev. 651, 678 (2012). ↑
- .Theodore Eisenberg, The CBP Race Study: A Pathbreaking Civil Justice Study and Its Sensitivity to Debtor Income, Prior Bankruptcy, and Foreclosure, 20 Am. Bankr. Inst. L. Rev. 683, 700 (2012). ↑
- .Braucher et al., supra note 33, at 405. ↑
- .Id. at 406–07. ↑
- .Id. at 411–12. ↑
- .Id. at 413–15. ↑
- .Greene et al., supra note 26, at 1086. Race appeared to be the second most important factor. Slightly edging out race, the variable with the largest impact (a 19% difference) was amount of unsecured debt. Id. The greater the amount of non-priority unsecured debt, the more likely the debtor was to receive a discharge. Id. at 1051. The authors argue that debtors with high levels of unsecured debt have increased incentives to complete their plans. Id. at 1089. ↑
- .Id. at 1060, 1086. ↑
- .Id. at 1086. ↑
- .Edward R. Morrison & Antoine Uettwiller, Consumer Bankruptcy Pathologies, 173 J. Institutional & Theoretical Econ. 174, 176 (2017). ↑
- .See 11 U.S.C. § 523(a)(7) (2012) (prohibiting discharge of government fines); id. § 1328(a)(2) (incorporating several nondischargeability provisions from § 523(a) into the chapter 13 discharge but excluding § 523(a)(7)). In addition, bankruptcy’s automatic stay prevents creditor collection activity while a debtor is in bankruptcy and lasts for the duration of a chapter 13 case. Id. §§ 362(a), 1301. ↑
- .Morrison & Uettwiller, supra note 74, at 187 fig.1. ↑
- .Id. at 185 tbl.4, 186. ↑
- . Id. at 194. ↑
- 79. Foohey et al., supra note 2, at 1077–80. ↑
- . Id. at 1089 fig.4. It is important to note that, even in low-chapter 13 districts, African-Americans are approximately 10% less likely to file chapter 7 as debtors of other races in the presence of controls. Id. ↑
- .Paul Kiel & Hannah Fresques, Data Analysis: Bankruptcy and Race in America, ProPublica (Sept. 27, 2017), https://projects.propublica.org/graphics/bankruptcy-data-analysis [https://perma.cc/KK6C-K75X]. ↑
- .Id. ↑
- .Id. ↑
- .Id. ↑
- .Dov Cohen, Robert M. Lawless & Faith Shin, Opposite of Correct: Inverted Insider Perceptions of Race and Bankruptcy, 91 Am. Bankr. L.J. 623, 630–32 (2017). ↑
- .Id. at 638. The authors surveyed these attorneys before publishing the results of their original work on race and chapter 13 in Less Forgiven: Race and Chapter 13 Bankruptcy. Cohen & Lawless, supra note 12, at 175. ↑
- .Cohen et al., supra note 85, at 638. ↑
- .Integrated Database, Fed. Judicial Ctr., https://www.fjc.gov/research/idb [https://perma.cc/ZSF6-PR4S]. ↑
- .IDB Bankruptcy 2008–Present, Fed. Judicial Ctr., https://www.fjc.gov/research/idb/interactive/IDB-bankruptcy [https://perma.cc/88VF-VV4W]. ↑
- .Id. ↑
- .American FactFinder, U.S. Census Bureau, https://factfinder.census.gov [https://perma.cc/6VAN-WRLW]. ↑
- .American Community Survey, U.S. Census Bureau, https://www.census.gov/programs-surveys/acs/ [https://perma.cc/WEV6-9D4D]. ↑
- .County Business Patterns, U.S. Census Bureau, https://www.census.gov/programs-surveys/cbp.html [https://perma.cc/G5KQ-XEUD]. ↑
- .Neil Bhutta, Payday Loans and Consumer Financial Health, J. Banking & Fin., Oct. 2014, at 230, 235. ↑
- .Office of Mgmt. & Budget, Exec. Office of the President, North American Industry Classification System (2017), https://www.census.gov/eos/www/naics/ [https://perma.cc/99S2-W2NQ]. ↑
- .See 11 U.S.C. § 1322(a)(2) (2012) (stating that, unless the creditor consents, all priority debts must be paid in full, although without interest); id. § 1322(b)(5) (providing an option to cure mortgage in default). ↑
- .Although the requirement that debtors pay all of their disposable income in chapter 13 would appear to lessen the relevance of income level to plan success, a debtor’s income also must be high enough to pay the required thresholds of secured and priority debt. Id. § 1325(b); see id. § 506(a)(2) (valuing collateral on secured debts); id. § 1322(a)(2) (requiring full payment of priority debts, although without interest); id. § 1322(b)(2) (prohibiting modification of mortgages on primary residences); id. § 1325(a)(5) (prohibiting modification of many secured debts in personal property). In addition, some districts require a certain percentage payment to the general unsecured creditors beyond the disposable-income requirement. Morrison & Uettwiller, supra note 74, at 189. ↑
- .Foohey et al., supra note 2, at 1074. ↑
- .Compare 11 U.S.C. § 727(a)(8) (2012) (listing an eight-year waiting period if prior discharge was in a chapter 7 case), and id. § 727(a)(9) (prescribing a six-year waiting period if prior discharge was in a chapter 12 or chapter 13 case), with id. § 1328(f) (requiring a two-year waiting period if prior discharge was in a chapter 13 case and a four-year waiting period if discharge was obtained via any other bankruptcy chapter). ↑
- .Sara Sternberg Greene, The Failed Reform: Congressional Crackdown on Repeat Chapter 13 Bankruptcy Filers, 89 Am. Bankr. L.J. 241, 252 (2015). ↑
- .See Angela Littwin, The Do-It-Yourself Mirage: Complexity in the Bankruptcy System, in BROKE: How Debt Bankrupts the Middle Class 157, 160 tbl.9 (Katherine Porter ed., 2012) (finding that represented debtors were approximately 45 times more likely to confirm chapter 13 plans than their pro se counterparts when controlling for demographic and bankruptcy variables). ↑
- .Mehrsa Baradaran, The Color of Money: Black Banks and the Racial Wealth Gap 141–42 (2017). ↑
- .Kiel & Fresques, supra note 81. ↑
- .Ethan Cohen-Cole, Credit Card Redlining, 93 Rev. Econ. & Stat. 700, 700 (2011); Simon Firestone, Race, Ethnicity, and Credit Card Marketing, 46 J. Money, Credit & Banking 1205, 1206 (2014). ↑
- .Braucher et al., supra note 33, at 417–18. ↑
- .Chapman, supra note 57, at 387 n.226. ↑
- .Van Loo, supra note 60, at 234. ↑
- .Bermant et al., supra note 50, at 24; Whitford, supra note 48, at 406–07. ↑
- .Braucher et al., supra note 33, at 415–16. ↑
- .Id. at 400; Foohey et al., supra note 2, at 1081. ↑
- .We also ran the same regressions with a binary variable for whether the zip code was majority black. We get a similar result: a 170% increase in the probability of filing under chapter 13 for persons living in majority-black districts. ↑
- .Braucher et al., supra note 33, at 404; Chapman, supra note 57, at 389; Foohey et al., supra note 2, at 1086; Van Loo, supra note 60, at 234. ↑
- .Braucher et al., supra note 33, at 423–24. ↑
- .See Bermant et al., supra note 50, at 24 (noting an “intensive chapter 13 practice runs in a broad band across the South and includes Puerto Rico”). ↑
- .Alabama, Arkansas, Florida, Georgia, Louisiana, Mississippi, North Carolina, South Carolina, Tennessee, Texas, and Virginia. See, e.g., G. Edward White, Recovering the Legal History of the Confederacy, 68 Wash. & Lee L. Rev. 467, 482, 495 (2011). ↑
- .Sullivan et al., supra note 7, at 834 n.105. ↑
- .Kiel & Fresques, supra note 81. ↑