CEO Pay Redux
Managerial power theory holds that structural flaws in corporate governance, such as board defenses, enable opportunistic managers to extract excessive pay. While this theory has proven highly influential, this Article argues that it fails to answer important questions. For example, how does managerial power theory relate to the prevailing economic paradigm of CEO pay as reflecting competition for scarce managerial talent? Further, how can one reconcile the theory’s negative account of board protection with recent empirical studies showing that such protection is value increasing?
In investigating these and other questions—both theoretically and empirically—this Article makes four contributions. First, it shows that adopting defensive measures (such as the staggered board) is not associated with significant changes in CEO pay. Second, it documents that greater competition for managerial talent is positively associated with CEO pay. Third, it shows that higher CEO pay is associated with higher firm value, especially in firms with a staggered board. Fourth, it provides plausible causal evidence that the decline in stock options (i.e., high-powered incentives) that followed the 2005 mandate to expense options is associated with increased firm value.
These results suggest that high executive pay serves to attract talented managers, rather than reflecting managerial opportunism. They also suggest that board protection might be beneficial to prevent market pressure from introducing value-reducing distortions in executive pay, such as an excessive use of high-powered incentives emphasizing short- over long-term performance. The Article concludes by discussing the policy implications of the analysis.
During the highly conflictual 2016 presidential race, the candidates agreed on at least one issue: the need to curb excessive executive pay. Then-candidate Donald Trump described CEO pay as “disgraceful . . . [and] a total and complete joke.”[1] Along similar lines, Hillary Clinton lamented that it “just doesn’t make sense” that today’s CEOs make 300 times more than the typical worker.[2]
The current political hostility toward CEO pay is unsurprising when considering the rising public outrage over executive compensation, especially after the 2007–2009 financial crisis. General discontent with executive pay is also not a recent trend; rather, “scrutinizing, criticizing, and regulating high levels of executive pay has been an American pastime for nearly a century.”[3] Since the early 2000s, however, this trend has found a systematic theoretical framework in the “managerial power theory” of executive compensation, espoused most prominently by Harvard law professors Lucian A. Bebchuk and Jesse M. Fried.[4]
Managerial power theory views the typical CEO pay package as a reflection of managerial moral hazard. Managerial moral hazard is the risk that managers may fail to exert sufficient effort and abuse their corporate power for personal gains.[5] In response to this risk, corporate law grants ultimate control over corporate affairs to the board of directors, as the institution charged with monitoring management decisions in the interest of shareholders.[6] Managerial power scholars, however, argue that structural flaws in corporate governance, such as board insulation from shareholder discipline through the use of defensive measures, make boards largely beholden to managers.[7] As a result, among other inefficiencies, managers can extract excessive pay or pay that is not tied to performance—in economic terms, “inefficient rents.”[8]
Managerial power theory has now become the dominant view in the law and economics literature.[9] It has also led to major regulatory changes promoting shareholder empowerment, which managerial power scholars defend as the most effective remedy to address excessive executive pay.[10] Most notably, in 2010, the Dodd-Frank Wall Street Reform and Consumer Protection Act yielded a series of new executive-compensation rules that, among other requirements, mandated that all U.S. public companies introduce nonbinding shareholder votes on CEO pay.[11]
Notwithstanding the far-reaching success of managerial power theory, this Article argues that this theory fails to convincingly answer crucial questions about executive compensation. In the first place, managerial power scholars fail to explain how one should reconcile their view with what this Article refers to as the “managerial talent theory” of executive compensation. The latter theory is the prevailing economic paradigm of executive compensation, pursuant to which CEO pay reflects compensation for scarce managerial talent in competitive markets.[12] Managerial talent theory thus challenges the view that the executive-compensation process is isolated from competitive pressure, as managerial power scholars seem to assume.
Further, managerial power theory is premised on a static, one-period model of executive compensation, where the manager initially makes decisions, and then investments are liquidated, gains or losses are realized, and the manager gets paid within the end of the single period.[13] In the real corporate world, however, the relationships between managers, boards, and shareholders tend to be “dynamic,” as investments typically play out along multi-period horizons and top executives hold their positions for several years.[14] Consequently, we raise the question of how moving from a static to a dynamic setting affects the positive or normative conclusions of managerial power theory.
Still, recent empirical work on the value impact of defensive measures documents that temporary board protection from shareholder interference, such as the protection granted by a staggered board,[15] is associated with increased firm value.[16] But if board protection can serve a positive governance function, how can it also be the main culprit for inefficient executive pay, as claimed by managerial power scholars?
In investigating these and other questions—both theoretically and empirically—this Article makes four basic contributions. First, it shows that the data do not support the managerial power claim that defensive measures are a source of distortions in CEO pay, as the adoption of such measures is not associated with significant changes in CEO pay levels or structure. Second, the Article documents that greater competition in the market for managerial talent is associated with statistically and economically significant increases in CEO pay, consistent with the predictions of managerial talent theory. Third, it documents that higher CEO pay is associated with higher firm value, especially in firms with a staggered board. Fourth, it provides plausible causal evidence that firms were overusing option-based pay (that is, high-powered incentives) in the early 2000s.
Overall, our analysis challenges the view that high executive wages generally constitute inefficient rents, indicating that such wages are instead often necessary to attract talented executives. It also suggests that protecting boards from short-term market and shareholder interference may promote a more positive relationship between CEO pay and firm value. This is because board protection makes it less likely that market forces introduce distortions in incentive schemes, such as an excessive use of high-powered incentives that inefficiently emphasizes short- over long-term performance.
The Article proceeds in five parts. In Part I, we provide the background necessary to understanding the context and importance of the executive-compensation debate, discussing the legal and economic foundations of the main theories of executive compensation.
Next, in Part II, we attempt to understand what difference a dynamic approach to executive compensation makes for the theoretical validity of managerial power theory.[17] As a positive matter, we argue that the more realistic assumption of a multi-period relationship between managers, boards, and shareholders produces several complexities for the analysis of managerial incentives, which managerial power theory fails to incorporate. In particular, in a dynamic setting, managers may develop incentives for engaging in inefficient intertemporal tradeoffs. The result is that shareholders not only are exposed to the risk of suboptimal managerial effort, but to the additional agency problem of short-termism (or managerial myopia).[18] This problem arises because managers—especially those compensated with high-powered equity incentives, such as option grants—may prefer investments that boost short-term returns (and a manager’s current pay) at the expense of losses only occurring in the future, which the manager discounts.
At the same time, a multi-period horizon enhances the opportunities for efficient incentive design, also challenging the normative conclusions of managerial power theory. When the board–manager relationship develops along multiple periods (as is commonly the case), the board can spread rewards for good managerial performance over time, while periodically reviewing the manager’s performance. This dynamic context allows the board to exploit a manager’s “continuation value,” that is, a manager’s expected payoffs from future employment periods.[19] Indeed, these expected payoffs provide a powerful bonding mechanism to ensure that exerting long-term effort is in the manager’s interest, as the manager anticipates that exerting suboptimal effort or engaging in myopic strategies increases the risk of being terminated and, therefore, losing the continuation value.
This conclusion offers a plausible explanation for the positive governance function of board protection documented in recent empirical studies, while warning against the potential costs of increased market pressure, whether coming from enhanced shareholder power or intense product competition.[20] When managers are subject to such market forces, they will rationally anticipate a greater risk of being removed in the near future and, therefore, substantially discount their expected continuation value. By preventing market forces from interfering with a manager’s continuation value, board protection might accordingly facilitate the design of pay schemes that promote long-term shareholder wealth.
Against this analytical background, Part III moves to the empirical investigation of the relationship existing between corporate governance and market forces, on the one hand, and CEO pay levels and structure, on the other. We begin by examining the relationship between the use of defensive measures and CEO pay. If the predictions of managerial power theory were accurate, we would expect to find that the adoption of such measures increases the likelihood that managers obtain higher pay or pay that is not sufficiently tied to performance. For example, pursuant to the claims made by managerial power scholars, we should find that CEO pay arrangements include larger portions of non-equity pay (e.g., cash, salary, and the like), which fail to directly align manager and shareholder interests.[21] Similarly, we would expect to find a greater use of restricted stock grants, which according to managerial power theory inefficiently provides managers with lower-powered incentives than the use of option grants.[22] In contrast with these predictions, we find no evidence that the adoption of defensive measures results in higher levels of executive compensation or changes in pay structure (neither before nor after the Dodd-Frank Act’s introduction of new compensation rules).
Next, we examine the effect on CEO pay of various forms of competition. These forms include labor-market competition for managerial talent, product-market competition, and competition through merger and acquisition (M&A) activity, which we interpret as a proxy for an industry’s shareholder pressure (as operating through the takeover channel).[23] Consistent with managerial talent theory, we document that competition for managerial talent has a substantial effect on both CEO pay levels and structure, as greater talent competition is positively associated with higher CEO pay levels and a larger proportion of restricted stock grants. This evidence suggests that the increase in CEO pay due to managerial talent competition largely comes from a greater use of restricted stock. On the contrary, greater product-market competition and M&A competition are associated with an increase in the option component of CEO pay and a decrease in the restricted stock component, indicating that boards tend to respond to stronger market discipline with more high-powered incentives.
Our analysis of the relationship between corporate governance, market forces, and CEO pay thus indicates that managerial talent competition is a critical source of increased CEO pay. Yet, the ultimate question, which we address in Part IV, is how current executive-pay levels and structure affect firms’ financial performance. Contrary to the predictions of managerial power theory, we find that higher CEO pay is associated with higher firm value.[24] Combined with our result that greater managerial talent competition is associated with higher CEO pay, this finding seems to suggests that, in general, high executive pay is not “excessive” in the sense described by managerial power scholars (that is, in the sense that it dissipates shareholder value). Rather, high executive pay seems to ensure that the most talented CEOs are allocated to the most valuable firms.
Further, we document that CEO pay is more strongly positively associated with firm value in firms that adopt defensive measures and, especially, a staggered board. Conversely, greater product-market competition and higher M&A competition interacted with CEO pay are associated with lower firm value. Taken together, these results support our theoretical predictions about the positive role of board protection in the executive-compensation process and the corresponding costs of market and shareholder pressure, indicating that boards that are temporarily protected from such market forces are better positioned to design value-increasing CEO pay arrangements.
Nevertheless, it could be argued that the results of our value analysis are subject to endogeneity concerns—the ever-present risk that correlation might be mistaken for causation.[25] For example, it could be that enhanced CEO effectiveness or expectations of future positive performance result in higher CEO pay, rather than higher pay causing better performance. To mitigate such concerns, Part IV also considers an event study that focuses on the 2005 introduction of Financial Accounting Standard (FAS) regulation 123(R).[26] FAS123(R) mandated that all public firms expense stock options, eliminating the prior privileged accounting treatment of options relative to restricted stock. As the product of regulatory intervention, this event can be regarded as independent from firm-specific circumstances and, therefore, as plausibly inducing exogenous changes in both the levels and structure of CEO pay (that is, changes that are outside a firm’s direct control). It follows that examining the subsequent performance of firms that were and were not affected by the introduction of FAS123(R) can plausibly provide causal evidence about the impact of modifications in CEO pay levels and structure on firm value. In particular, as FAS123(R) leveled the playing field between the use of options and restricted stock from an accounting perspective, we expect such an event study to provide us with additional insights into the relative efficiency of more versus less powered incentives.
We show that FAS123(R) led to a significant reduction in the option component of executive pay for affected firms that had outstanding options. More importantly, we also show that the more firms reduced option grants in favor of restricted stock grants in the two years after the rule change, the greater the increase in firm value. Combined with our finding that greater market and shareholder pressures are associated with a larger use of option grants, these results confirm the above interpretation of our value analysis that market forces might introduce distortions in optimal incentive design, such as an excessive use of high-powered incentives that overemphasize short-term performance at the expense of long-term firm value.
From a normative perspective, as discussed in Part V, our analysis provides important insights for the social welfare implications of the executive-compensation debate. Our central results are that high executive pay is generally efficient in attracting talented managers, while enhanced market and shareholder pressure may produce value-reducing distortions in executive-pay schemes. Based on these results, we defend the traditional deference paid by Delaware courts to board decision-making in executive-compensation matters as normatively desirable. We likewise defend temporary board protection as a means to promote, rather than jeopardize, the efficiency of executive-compensation plans—including by mitigating the risk that boards might overuse high-powered incentives in response to excessive market pressure. More broadly, we argue that policymakers would do well to reconsider the case for enhanced shareholder power in the executive-pay process,[27] as this case emerges as both theoretically and empirically wanting.
I. Theories of Executive Compensation
This Part assesses the major theories of executive compensation, as developed in both legal and economic models. The agency problem between shareholders and managers is the common departure point of these theories. Indeed, as first famously espoused by Berle and Means,[28] and later formalized by Jensen and Meckling,[29] the separation of ownership and control in the public corporation creates the risk that managers may engage in moral hazard, taking “hidden actions” in their own self-interest and at the expense of shareholders. The question, however, is whether executive compensation provides a means to address this quintessential agency problem or, rather, is part of it.
As explained in the discussion of what is commonly referred to as “optimal contracting theory” in subpart A below, executive-compensation research initially developed on the agency-theoretic premise that compensation plans provide an efficient contractual mechanism to mitigate managerial moral hazard. However, as discussed in subpart B, managerial power theory, which first emerged in the early 2000s, has challenged this premise, arguing that compensation plans reflect managerial moral hazard rather than mitigating it. Partially in response to this criticism, more recent “managerial talent theory” studies, which we discuss in subpart C, have proposed an expansion of the traditional agency model of executive compensation, moving beyond the bilateral contracting framework and emphasizing additional dimensions, such as competitive forces in the labor market for managerial talent.
1. Law.—The classic theory of executive compensation—referred to as “optimal (or efficient) contracting theory”—posits that compensation arrangements are designed by the board of directors to provide executives with incentives to refrain from moral hazard and maximize shareholder value.[30]
From a corporate law perspective, optimal contracting theory captures the central role served by the board of directors as the organizational body charged with mitigating the shareholder–manager agency problem.[31] Indeed, corporate law separates “decision management” and “decision control,” delegating business decision-making to managers, while vesting the board with the authority to ratify and monitor management actions on behalf of shareholders.[32] To this end, directors are granted a vast array of powers, including the power of selecting and removing the CEO and other top executives, as well as the power of setting executive-compensation arrangements.
Reflecting the assumption that executive compensation is a matter efficiently delegated to board discretion, corporate law also provides for minimal judicial review of executive-compensation decisions, extending to such decisions the protection of the business judgment rule.[33]
2. Economics.—From an economic perspective, optimal contracting theory frames executive compensation as a remedy to reduce the moral hazard costs faced by shareholders.[34] Such costs arise because the principal (the shareholders) faces the problem of inducing effort by the agent (the managers)—or, put differently, avoiding the agent’s moral hazard, for example in the form of private-benefits extraction[35]—despite being unable to observe all of the actions the agent takes.[36] The fundamental insight from the principal–agent model is that incentivizing effort requires giving the agent a monetary payoff, an agency rent, such that the exercise of effort is in the agent’s own interest.[37]
Therefore, the board’s essential problem is designing a contract that can maximize managerial effort, while minimizing the costs of providing incentives (the agency rent awarded to the manager). More specifically, the optimal contract maximizes shareholder value subject to two constraints. The first is the manager’s participation constraint, which requires shareholders to pay the manager her reservation utility, that is, the value of her next-best employment opportunity available (also referred to as “outside option”).[38] The second is the manager’s incentive constraint, which requires shareholders to compensate the manager for choosing actions that maximize shareholder value rather than pursuing opportunities that the manager privately prefers but result in lower shareholder value.
The contracts that solve this optimization problem involve compensation schemes that tie CEO pay to shareholder value,[39] thus providing the theoretical justification for the current prevalence of equity-based compensation (such as stock options and restricted stock) over fixed compensation in CEO pay packages.[40] The intuitive case for equity-based compensation is straightforward: when financial rewards are guaranteed, managers are assumed to have no reason to avoid self-serving behavior. In contrast, when pay is anchored to increased shareholder value, managerial incentives are aligned with the interests of shareholders, mitigating moral hazard.
A simple example helps illustrate the economics of optimal contracting theory. We assume that a Board needs to set the compensation plan of a Manager who has an outside option valued at $5.[41] The Manager can take a project that generates revenues of $1,000 with probability 80% or revenues of $0 with the remaining 20% probability. To stylize the possibility of moral hazard, we assume that the Manager has the possibility of extracting a private benefit of $4, in which case the probability of the project’s success drops to 60%.[42] This means that in order to maximize the project’s chances of success, the Manager has to bear a cost of $4, which corresponds to the “disutility” of effort[43] of giving up private-benefit extraction.
Under these assumptions, the problem for the Board[44] is twofold. On the one hand, the Board needs to prevent the Manager from extracting the private benefit of $4, as this is detrimental to shareholder value.[45] On the other hand, under standard asymmetric information assumptions, the Board cannot observe whether the Manager engages in private-benefit extraction and therefore cannot make the Manager’s payoff schedule contingent on her actions. Otherwise, assuming symmetric information, the Board could simply write a state-contingent contract under which it would pay the Manager $4 if she does not engage in private-benefit extraction.
In order to solve these problems and make the Manager’s contract incentive compatible, the Board will need to provide the Manager an agency rent that awards the Manager part of the project’s returns. Specifically, the efficient agency rent to be left to the Manager is the minimum amount of the project’s returns that can satisfy both the Manager’s participation constraint (PC) and incentive constraint (IC). Under the Manager’s PC, the Manager needs to receive at least the value of her outside option ($5). Under the Manager’s IC, the Manager must be at least as well off when she exerts effort as when she does not (that is, when she extracts the private benefit of $4).
In our setting, the Board can satisfy both these constraints by promising a percentage (%)of the project’s returns to the Manager, so that the Manager’s IC can be written as: (0.8) [% ($1,000)] (0.6) [% ($1,000)] + $4.[46] This condition implies that the Manager’s IC is satisfied for 0.02 (or a percentage of at least 2%); that is, by promising the Manager an agency rent of $20 in case of the project’s success (i.e., 0.02 $1,000). This compensation schedule also satisfies the Manager’s PC as (0.8) ($20) = $16 $5, therefore providing the Manager with incentives to exert optimal effort.[47]
1. Law.—Managerial power theory conceives of typical executive-compensation packages as part of, rather than a remedy to, the moral hazard problem arising in the public corporation. Conceptually, this theory—expounded in a series of studies by Lucian A. Bebchuk and Jesse M. Fried[48]—relies on negating a central assumption of optimal contracting theory. The negated assumption is that the board is able to act as a faithful guardian of shareholder interests and, hence, to take an adversarial position against management in negotiating efficient compensation arrangements.[49] Instead, managerial power theorists argue, the delegation of “decision control” from shareholders to directors results in its own set of agency costs, which largely mirror those arising between shareholders and managers.[50]
Further, neither competitive forces outside the firm nor corporate law rules could mitigate directorial moral hazard costs. First, managerial power scholars argue, boards are largely immune from the forces arising from product- or labor-market competition as well as insufficiently interested in any financial benefits from M&A deals.[51] Therefore, market forces can impose at best light constraints on executive compensation.[52] Second, fiduciary rules provide only weak deterrence against directorial moral hazard especially in the executive-compensation context, due to both the traditional reluctance of courts to intervene in compensation matters and excessively high enforcement costs.[53] Third, and most importantly, the shareholders’ power of removing directors (and their appointed officers, the managers) is “largely a myth”[54] as a result of managerial entrenchment and board capture.
Under the managerial power view, entrenchment arises when directors gain protection from the threat of removal through the adoption of defensive measures that make it difficult for shareholders to replace incumbents.[55] Classic examples of such measures include poison pills and staggered boards.
A poison pill (also called a shareholders’ rights plan) is a defensive measure that, when implemented, so dilutes a bidder’s economic rights that the only way to complete a hostile takeover is to first appoint a new majority of directors who can remove the pill.[56] When a board is staggered, however, a bidder’s ability to do so is reduced because directors are grouped into different classes—usually three—serving staggered terms where each class stands for reelection in successive years. This requires a prospective hostile bidder to endure the costly delay of waiting through two election cycles before being able to replace a majority of the board. As a result, the adoption of a staggered board, in addition to a poison pill, provides directors with a very potent defense against hostile takeovers.[57]
Likewise, for managerial power scholars, entrenchment is favored by incumbents’ exclusive access to the corporation’s proxy machinery, which raises prohibitive procedural costs for prospective challengers.[58]
By weakening the disciplining effect of the threat of removal, entrenchment would allow top executives—who control the flow of information from lower corporate layers to the board and, more importantly, the board-appointment process—to capture directors, making them subservient to management.[59] As a result, managerial power scholars argue that directors are unable to engage in arm’s-length compensation negotiations on the shareholders’ behalf, while managers can exploit the power they hold over boards to extract excessive remuneration.[60]
For these scholars, the cost of excessive CEO pay also is substantial and reaps a significant portion of shareholder wealth.[61] Further, managers’ ability to influence the executive-pay process results in weak or even perverse incentives. That is, managers are able to obtain compensation plans that are decoupled from firm performance or even promote results misreporting, the suppression of bad news, and the undertaking of projects that are not transparent.[62]
2. Economics.—In economic terms, the central claim underpinning managerial power theory is straightforward: board capture enables executives to extract “entrenchment rents,” that is, returns above the executives’ agency rents.[63] This account of executive compensation would explain why a substantial part of executive compensation is provided in the form of non-equity components, which are not, or only poorly, tied to performance—including cash salary, bonus plans, signing bonuses, split-dollar life insurance policies, and severance payments.[64]
Accordingly, a managerial power theorist would claim that the Board in our example above would not just grant the Manager an agency rent equal to 2% of the project’s expected returns. Rather, the Manager would be able to influence the Board’s decision-making process to obtain additional pay—for example, in the form of a fixed bonus of $10 to be paid on top of the 2% agency rent. This bonus would correspond to an entrenchment rent, providing the Manager with value beyond what is needed to preserve the Manager’s incentives to exert effort and hence decreasing shareholder value.
Of course, this is just one trivial representation of the many ways through which managers can extract entrenchment rents according to managerial power scholars. For example, another way managers could extract rents is by bargaining for equity-based compensation in the form of restricted stock rather than stock options.[65] Both restricted stock and stock options tie managerial pay to stock-price performance and shareholder value. Restricted stock, however, does so in a linear way, moving dollar for dollar with the firm’s share price. Therefore, the gains or losses of a manager that is compensated with restricted stock are the same as those of shareholders. Conversely, stock options (which are technically call options) deliver managers asymmetric payoffs. A call option is only valuable to managers if the share price at the option’s exercise date is higher than the option’s strike price. This makes managers highly sensitive to even small changes in share value above the option’s strike price, while they are relatively insensitive to changes in share value below the strike price. It follows that option-based pay produces more high-powered incentives per dollar of compensation expenses than stock-based pay and, therefore, is seen as a less costly way of paying out necessary agency rents.[66]
A further modification of our example is useful to clarify this point. Recall that the Board’s essential problem in designing the Manager’s contract is that it cannot observe whether the Manager exerts effort or extracts a private benefit of $4. In order to stylize the use of restricted stock versus options, we assume that at the time the Board sets the Manager’s compensation plan, each company share is worth $1. We further assume that if the Manager exerts effort, within a year the share value will increase to $1.2 with probability 80%, while it will drop to $0.8 with probability 20%. Under these assumptions, the expected value of the company’s share price equals $1.12. Conversely, if the Manager does not exert effort, within a year the share value will increase to $1.2 with probability 30%, while it will drop to $0.8 with probability 70%. With the lack of managerial effort, the expected value of each share thus decreases to $0.92.
Let’s now assume that the Board decides to pay the Manager’s agency rent using restricted stock, granting a number (# Shares) that can satisfy the Manager’s incentive constraint (again, IC). Assuming, for simplicity, that the Manager is risk-neutral and does not discount future income (such that she is indifferent between receiving $4 now versus later), the Manager’s IC can be written as: [(# Shares) ($1.12)] – $4 [(# Shares) ($0.92)]. Therefore, the incentives to be left to the Manager under a restricted stock plan are equal to $20 ($4/0.2) shares, which translates into an expected cost for the shareholders equal to $20 $1.12 = $22.4.[67]
On the contrary, should the Board decide to pay the Manager’s agency rent through call options with a $1 strike price, the option would give the Manager the following payoff: Max[Stock Value at Exercise – $1, 0]. This means that the Manager will only exercise her option when Stock Value at Exercise exceeds $1, which materializes with probability 80% when the Manager exerts effort and with probability 30% when she does not exert it. Therefore, the option’s expected value to the Manager equals 80% [$1.2 – $1] = $0.16 when the Manager exerts effort, and 30% [$1.2 – $1] = $0.06 when she does not. The Manager’s IC under the option plan can thus be written as: (# Options worth $0.16) (# Options worth $0.06) + $4.[68] Consequently, the Manager needs to receive at least 40 options to exert effort ($4/0.1 = 40), with an expected cost to the company of ($0.16) (40) = $6.4.
For managerial power theorists, then, the difference of $16 between restricted stock costing $22.4 and options costing $6.4 would be the entrenchment rent captured by the Manager.[69]
1. Law.—What we refer to as the “managerial talent” theory of executive compensation[70] broadens the optimal contracting approach to account for additional dimensions, including market forces operating in a competitive equilibrium.[71] Thus, while for expositional convenience we treat these theories separately, managerial talent studies could also be regarded as part of optimal contracting theory.[72] Indeed, from a legal perspective, the assumptions underpinning optimal contracting theory continue to remain valid for managerial talent theory, which also conceives of compensation as a matter efficiently delegated to the central authority of the board. As explained below, however, managerial talent theory considers optimal board contracting in the executive-compensation process as not just resulting from bargaining between boards and shareholders, but as influenced by exogenous market forces as well.
2. Economics.—Economically, managerial talent studies employ competitive equilibrium models, maintaining that the models of bilateral contracting employed in optimal contracting theory cannot capture the complexities of actual CEO-employment relationships.[73] These complexities arise from the fact that the incentives to be provided to executives are not determined “in a vacuum,” as if boards and CEOs were insulated from market competition. Rather, such incentives reflect a competitive equilibrium in the market for scarce managerial talent, where “it may be optimal to pay high wages to attract talented CEOs, and implement high effort from them even though doing so requires paying a premium.”[74] Under this view, high executive pay would thus reflect the high agency rents to be paid to preserve managerial incentives in a competitive labor market with a limited supply of managerial talent rather than entrenchment rents. For expositional clarity, we refer to such high but efficient executive rents as “market rents” to distinguish compensation premiums driven by competitive market forces from “pure” agency rents.[75]
A further modification of the basic example introduced above can serve to clarify the concept of market rent. As a stylized representation of a competitive market context, we add an additional corporation (Corporation II), referring to the board of our initial corporation (Corporation I) as Board I and the board of this additional corporation as Board II. As is standard in competitive labor-market models, we assume that there is scarcity of managerial talent and that our Manager has rare talent, such that both Board I and Board II are interested in hiring the Manager. Specifically, we assume that Board II is willing to pay the Manager a compensation package of $40.
Under these circumstances, the original expected compensation of $16 no longer suffices to satisfy the Manager’s participation constraint,[76] which has now increased to $40 because of Board II’s employment offer. Therefore, in order for Board I to retain the Manager, Board I will need to pay the Manager not just the pure agency rent of (0.8) ($20) = $16, but also a market rent of $24 to match the offer of Board II.[77] Importantly, under the assumption of scarce managerial talent, it is reasonable to pose that should Board I not pay the Manager this market rent, the Manager would join Corporation II, while Board I would be forced to hire a less talented manager with lower productivity, resulting in a loss in shareholder wealth.[78]
II. Towards a Dynamic Approach
Part I has outlined the essential elements of the main theories of executive compensation. It has not, however, surveyed the empirical literature that examined whether the different predictions generated by each theory are confirmed by the data because space constraints would force us to omit many important contributions. We thus refer the reader to the excellent surveys by John Core, Wayne Guay, and David Larcker,[79] and Carola Frydman and Dirk Jenter.[80]
As documented by these surveys, the empirical literature on executive compensation has generally yielded mixed results, failing to identify a consistent relationship between one set of theoretical predictions and the data.[81] For example, while board capture constitutes an essential element of managerial power theory, the available empirical evidence seems not to support the existence of systematically passive and captured boards.[82] On the contrary, indicators of board independence have steadily improved since the 1980s,[83] and CEO turnover rates have also increased,[84] thus suggesting that boards do not refrain from disciplining poorly performing executives. Conversely, the data generally confirm that the CEO labor market has become increasingly more competitive[85]—consistent with the assumptions of managerial talent theory. Yet, it remains empirically uncertain whether growing competitiveness in the managerial labor market can fully explain the increase in executive-pay levels and the changes in the structure of executive pay that have occurred over the past decades.
As a matter of fact, however, managerial power theory has largely gained the upper hand in recent years, proving very influential in both academic and political circles and leading to major regulatory changes, especially in the United States. In 2006, for example, the Securities and Exchange Commission (SEC) mandated increased disclosure of compensation policies, requiring, among other things, that companies specifically address the role of executives in the pay-setting process.[86] Further, and explicitly taking into account the concern of managerial power scholars, the SEC also required a more detailed articulation of compensation items that might potentially constitute a perquisite.[87] Most notably, in 2010, the Dodd-Frank Wall Street Reform and Consumer Protection Act introduced a series of new executive-compensation rules affecting all public companies, including rules designed to bolster the independence of compensation committees and mandating that companies introduce nonbinding shareholder votes on executive compensation.[88]
These reforms share one common feature: they all embrace the call for shareholder empowerment that managerial power scholars have long defended as the necessary remedy to what they see as the widespread problem of excessive executive pay.[89] Underpinning that call is these scholars’ belief that only by strengthening the governance rights of shareholders can directors be trusted to faithfully serve shareholder interests, rather than be captured by opportunistic managers. To this end, in addition to favoring an enhanced role of shareholders in the pay-setting process, managerial power scholars defend the need to remove the barriers that insulate directors from shareholder discipline, such as defensive measures.[90]
This claim notwithstanding, recent work on the value impact of defensive measures, including our own research, does not support the view that stronger shareholder rights are an all-purpose remedy in corporate governance.[91] In particular, two of us have showed elsewhere that the adoption of a staggered board is associated, on average, with increased firm value, while not being associated with a lower CEO turnover.[92] This evidence poses a challenge to managerial power theory. Under this theory, one would expect to find, on the one hand, that the adoption of takeover defenses decreases firm value. On the other hand, such measures should be associated with a lower CEO turnover, as managerial power scholars argue that insulated boards are more likely to be captured by executives and hence less likely to fire them in case of poor firm performance.[93] In contrast, both these theoretical predictions are rejected by the data.
More generally, this evidence raises several questions about the explanatory power of managerial power theory. First, if boards that are protected from short-term shareholder interference seem better placed to promote long-term shareholder wealth, how can board protection be the main source of allegedly inefficient executive pay, as argued by managerial power scholars? If, on the other hand, board protection does not hamper the executive-pay process, perhaps it can serve a positive function within this process? Further, is there any link between the results we obtain on board protection and managerial talent theory? The attempt to answer these questions provides the motivation for the analysis we develop in this Article. Our interest lies in these questions’ theoretical implications, which we discuss in this Part, as well as their empirical implications, which we explore in Parts III and IV below.
Theoretically, these questions point to a complex relationship between corporate governance, market forces, and executive compensation. In analyzing this complexity, we draw on some critical analysis that Bengt Holmström, 2016 Nobel laureate in economics, offered on incentive design about a decade ago.[94] First, Holmström observed that the right economic framework for studying executive compensation is that of “[d]ynamic models, where commitment problems and implicit incentives arise out of incomplete contracting and renegotiation.”[95] This remark emphasizes that the nature of the relationship between managers, shareholders, and boards is not that of a static, one-shot transaction as envisioned within managerial power theory. Rather, such a relationship tends to develop along a multi-period horizon, with managers typically holding their positions for several investment periods.[96] As we argue in subpart B below, taking into account the dynamic nature of executive-compensation contracts sheds new light on the relationship existing between agency rents, entrenchment rents, and market rents.
Second, and relatedly, Holmström argued that the claim “that shareholders know what is best for them breaks down in a world where commitment to an ex post inefficient course of action is valuable ex ante.”[97] As explained in subpart C, this analytical framework suggests that attempts at reducing moral hazard costs ex post (that is, after a manager’s hire) by strengthening shareholder governance rights might impair a board’s ability to design efficient incentive schemes ex ante (that is, upon a manager’s hire), in turn calling for a novel evaluation of the respective costs and benefits of shareholder empowerment and board protection.
B. Dynamic Compensation Contracts
Convenience and tractability issues explain why scholars often prefer static settings to dynamic ones. The study of executive compensation is no exception. After all, so the common argument goes, as long as using a more tractable single-period setting does not change the general conclusions of the analysis, there is no need to overly complicate executive-compensation discussions.[98] However, the more recent economic literature on executive compensation emphasizes that taking into account the complexities of dynamic, strategic, and repeated interactions between executives, firms, and markets may lead to significantly different conclusions about whether executive-compensation theories can accurately predict observed compensation practices.[99] In other words, the risk is that static models may be not just simple, but ultimately simplistic.
Drawing on this recent literature, we argue that once the relationship between managers, boards, and shareholders is more realistically represented as taking place in a dynamic and competitive setting, several important implications follow—regarding both managerial incentives and the opportunities of boards and shareholders to design efficient compensation schemes.
1. Dynamic Incentives.—On the incentives side, a dynamic setting can incorporate essential features of executive-compensation contracts as they are negotiated and implemented in the actual corporate world. First, real-world settings show that the relationship between incentives, rents, and competition can be more complex than described in Part I. We can again use the example we introduced above to better illustrate this point. For simplicity, in that example we considered only a single period, where at the beginning of the period, in “the present,” the board implements the compensation schedule and the manager makes investment decisions, and at the end of the period, in “the future,” gains or losses are realized and the manager gets paid. In this static setting, competitive market forces only operate in “the present,” causing an increase in the manager’s reservation utility and, accordingly, requiring that the manager be paid market rents, in addition to agency rents.[100] However, once one allows for multiple investment periods and hence the availability of interim information based on the realization of interim payoffs, increased competition for managerial talent produces additional complexities.
On the one hand, shareholders will be interested in both the manager’s current contribution and those arising from her continued employment. On the other, initially optimal incentives may lose power over time. Indeed, if interim payoffs are positive, the manager’s reservation utility will likely increase over subsequent periods, as positive interim payoffs can be expected to make the manager more appealing to competitors.[101] Accordingly, competition may produce a negative externality, rendering the initial compensation contract no longer apt to satisfy the manager’s participation constraint in future periods.
In the context of our example, this means that paying the Manager a market rent of $24 in addition to an agency rent of $16 might not be sufficient to provide the Manager with long-term incentives to exert optimal effort in Corporation I.[102] This is because a successful Manager might have additional employment options available after the positive realization of interim payoffs, with such offers likely exceeding the current Manager’s total rent of $40.
Further, a dynamic setting also accounts for a manager’s ability to engage in inefficient intertemporal tradeoffs, which potentially exposes shareholders to an additional agency problem: short-termism (or managerial myopia).[103] In a static setting, the main concern for shareholders is that a manager may fail to exert optimal effort. The provision of equity incentives, which tie CEO pay directly to shareholder wealth, is the standard solution to this problem.[104] In a dynamic setting, however, a manager compensated through equity-based pay may develop incentives for investments that boost short-term returns (and thus a manager’s pay), at the expense of lower gains or even losses occurring in the longer-term and which, therefore, the manager discounts.[105]
Excessive risk-taking provides a classic example of short-termism, as it became evident during the 2007–2009 financial crisis, when the huge underlying risks associated with U.S. banks’ investments in the highly remunerative subprime market finally materialized.[106] Another classic example includes cutting specific investments—for example, investments in R&D or employee training—that would pay off later on. Importantly, increased competition may exacerbate short-termist incentives. Indeed, a manager who can depart to a new employer before any long-term loss materializes will be naturally more inclined to engage in short-termist strategies. In this environment, improving short-term performance at the expense of long-term value will not only boost a manager’s current pay, but also her chances at upward mobility, at once increasing the value of the manager’s outside option and the likelihood of sidestepping losses arising in the future.[107]
2. Dynamic Pay and Committed Managers.—In addition to the above challenges, a dynamic setting simultaneously offers additional avenues for efficient incentive design, as it allows boards to spread the rewards for good managerial performance over time while periodically reviewing the manager’s performance. In other words, in a dynamic setting, the board can “exploit” a manager’s continuation value—that is, a manager’s expected payoffs from future employment periods (assuming that the manager is not fired for poor performance)—as a powerful bonding mechanism to commit the manager to the creation of long-term firm value.
This dynamic approach to executive-pay design sheds new light on the function served by allegedly inefficient entrenchment rents—that is, compensation premiums that exceed a manager’s total rent, as given by the sum of agency rents and market rents. Contrary to the assumptions of managerial power scholars, this approach shows that such rents can help to commit executives to the exercise of long-term effort.
Consider, for example, the use of fixed compensation, which managerial power scholars describe as the quintessential form of “pay-without-performance” and, hence, as primary evidence of inefficient rent extraction.[108] In contrast with this view, in a multi-period setting, fixed compensation can provide efficient incentives, as long as the manager’s expected gains from future employment periods offset her disutility cost of effort. A rational manager anticipates that low effort increases the likelihood of poor interim performance[109] and, therefore, that she might be removed in the near future. Because managerial removal triggers the loss of continuation payoffs, the manager will then have incentives to exert effort.[110]
Fixed compensation may likewise provide a mechanism to mitigate the negative externalities that competition may introduce in incentive schemes. Consider again our example. Recall that in a competitive, dynamic setting, paying the Manager the total rent of $40 (that is, the $16 agency rent plus the $24 market rent) is no longer sufficient to satisfy the participation constraint of a talented Manager over time. In this context, paying the Manager more than the $40 total rent—for example, by granting the Manager an additional fixed bonus of $10 to be paid out each period the Manager continues to be employed—should thus be regarded as an efficient, rather than inefficient, rent. Under this compensation arrangement, the Manager will trade off any potential future increase in her reservation utility against her expected continuation payoffs, including expected future bonuses. It follows that providing the Manager with extra compensation may help promote the Manager’s long-term commitment to Corporation I and, ultimately, long-term shareholder wealth.
Similar considerations apply to the use of restricted stock instead of stock options to compensate executives. As discussed above, managerial power theorists are critical of restricted stock, arguing that providing incentives through this compensation component is more costly to shareholders than doing so through options.[111] When considered from a dynamic perspective, however, the use of restricted stock can serve a positive function, as the higher expected value that restricted stock provides to managers—relative to option grants—might help secure the long-term commitment of talented managers. Thus in our example above when the Manager is compensated through restricted stock she expects to receive a value of $22.4, which is considerably higher than the expected value of $6.4 the Manager receives under an option plan.[112] What managerial power scholars generally do not consider, however, is that in a dynamic, competitive setting, the higher value accruing to the Manager increases the likelihood that a successful Manager will stick to Corporation I over time.
Designing executive pay dynamically can similarly help mitigate myopic managerial incentives, as long as a manager’s pay package is designed to ensure that the manager’s expected payoffs from future employment periods offset the gains she might obtain out of a short-termist strategy today. Our example is again helpful to clarify this point. As a stylized representation of a dynamic setting, we assume that after “the present,” there are two periods, where in each period $1,000 can be generated with some probability. For simplicity, we pose that the Manager cannot engage in private-benefit extraction in this modified setting, so that, under the assumption that the Manager will exert effort, the project she undertakes has an 80% probability of success in each period.
Here, however, the Manager can make a myopic choice, meaning that she can boost the payoff from the first investment period at the expense of the payoff from the second period. In particular, assume that the Manager can choose an investment strategy (e.g., cutting long-term investments in R&D) that increases the probability of a successful first-period realization from 80% to 85%, but simultaneously reduces the likelihood of a successful second-period realization from 80% to 60%. In our example, this choice is clearly inefficient, as it decreases the shareholders’ expected returns. Nevertheless, for the Manager, such behavior is the most profitable choice when she does not expect to receive a continuation payoff. Assuming market rents away—for simplicity, but with no loss of generality—when the Manager only expects to receive her agency rent, she can increase her expected first-period compensation from (0.8) ($20) = $16[113] to (0.85) ($20) = $17 by behaving myopically. Further, a successful first-period performance will also enhance the Manager’s chances for improved outside mobility and, therefore, for sidestepping the longer-term losses arising from a short-termist choice.
Conversely, if the Manager expects to receive a continuation value in the form of an additional rent of $10 per period, the Manager will trade off the short-term increment from the myopic strategy against the higher likelihood of losing her continuation value. In the case of myopic managerial behavior, the Manager reduces the likelihood of receiving the second-period rent of $10 from 80% to 60%. By undertaking a myopic strategy, the Manager can thus expect to lose $2 in the second period, which is more than what she gets out of the myopic strategy in the first period. Accordingly, a rational Manager will not engage in myopic behavior.
Lastly, it is important to emphasize that any form of compensation above a manager’s total rent can be used to provide managers with efficient incentives to mitigate the risk of managerial myopia. In particular, results analogous to those described above for the use of fixed compensation can be achieved by using restricted stock instead of stock options. As is extensively discussed in the executive-compensation literature, especially after the recent financial crisis, the asymmetric payoff of options may give managers greater incentives to opportunistically exploit intertemporal tradeoffs—particularly in the form of excessive risk-taking.[114] This is because the sensitivity of option-compensated managers to even small changes in the share price around a call option’s strike price tends to exacerbate a manager’s incentives to undertake strategies that boost short-term stock prices.[115] Conversely, the linear payoff of restricted stock, combined with the instrument’s vesting-period restrictions, anchor a manager’s payoff to long-term shareholder value, therefore mitigating managers’ incentives for short-termism.
C. Commitment, Competition, and Shareholder Power
The above discussion has shown that under the realistic assumption of a dynamic setting with competition for scarce managerial talent, boards can design a manager’s expected rents from future employment periods to commit talented managers to the long-term exercise of effort, as well as to mitigate the risk of managerial myopia. Nonetheless, a managerial power theorist could object that this conclusion rests on the wrong conceptualization of the shareholders’ power of removal. Indeed, the design of dynamic compensation contracts rests on a board’s ability to both reward successful managers and remove poorly performing managers. According to managerial power scholars, however, in the real corporate world, the use of defensive measures and other barriers undermines the shareholders’ own power of removing directors, which would produce entrenched boards beholden to top executives.[116] Consequently, the assumption that boards would fire an underperforming manager is misplaced. Thus, even under a dynamic approach one should conclude that efficient executive pay requires shareholder empowerment, as only in this way could directors and managers be held accountable for poor firm performance.
The above argument, however, neglects to consider that the creation of long-term firm value presupposes a bilateral commitment, from both managers and shareholders. This requires, on the one hand, providing managers with rents that make it in a manager’s self-interest to exert long-term effort. On the other hand, it requires overcoming what we have referred to in prior work as the shareholders’ “limited commitment problem.”[117]
This problem arises because, upon the realization of a disappointing firm outcome (that is, low short-term earnings), shareholders always have the option to challenge the board and its appointed officials, the managers. They can do so in several ways—for example, supporting activist hedge funds, submitting shareholder proposals,[118] voting against management, or selling their shares in a hostile takeover attempt. However, under the conditions of informational asymmetry existing in the real corporate world, a disappointing firm outcome might be only temporary and reflect an investment whose value will materialize only later on. Put differently, the assumption that an opportunistic manager is generally more likely to be associated with disappointing firm outcomes in the short term[119] breaks down once one considers that directors and managers have private information that cannot easily be shared with outside shareholders. Therefore, as market prices may fail to capture the implications of private information until those implications begin to show up in cash flows over time, shareholders would benefit from supporting, rather than challenging, board actions in the short term.[120]
This analytical framework suggests that the benefits of shareholder empowerment—and, more generally, increased market discipline—need to be evaluated alongside their costs, while also indicating that temporary board protection might serve a positive governance function within the executive-pay process. When shareholders are empowered to intervene in corporate affairs “at all times”—as advocated by managerial power scholars—they are unable to provide a credible ex ante commitment not to challenge the board and managers in the short term. This problem is likely to be exacerbated in firms operating in markets with intense product competition. This is because in a context where managerial performance is evaluated in relative terms over fairly short periods of time and under the imperative of “beating competitors,” shareholders might become even more impatient. In turn, they will be even less willing to support current board and managerial actions when faced with disappointing short-term firm performance, regardless of whether this outcome might be only temporary.
In an environment with increased shareholder power or intense product-market competition, a rational manager will accordingly anticipate a much higher risk of being removed in the near future. Under this risk, the manager will substantially discount her expected continuation payoff. The manager will also be more likely to develop short-termist incentives, as positive short-term results can be expected to reduce the risk of future managerial removal. As a result, a manager’s expected continuation value might no longer be sufficient to offset her current cost of effort, or her future reservation utility increases, or, still, near-term gains from myopic investments—all circumstances that jeopardize a board’s ability to design effective pay schemes under the dynamic approach described above.
By limiting the impact of short-term shareholder and market pressure on board decision-making, temporary board protection may help preserve a manager’s continuation value and thus the ability of boards to design efficient pay schemes. When a board is protected from short-term shareholder interference and, more broadly, market pressure, managers will rationally anticipate a lower risk of being removed in the short term. It follows that it will be easier for boards to efficiently design a manager’s continuation payoff to promote long-term managerial effort.[121]
This does not mean that board protection should be perpetual. On the one hand, market prices can be expected to better incorporate uncertainty about current projects and a board’s strategy over time, as the implications of directorial decisions materialize into actual cash flows. On the other hand, perpetual board protection would make the threat of removing underperforming managers no longer credible, which would likewise sabotage incentive schemes. However, in contrast to what is argued by managerial power scholars, most defensive measures are not perpetual. A staggered board, for example, does not permanently limit market discipline, but rather provides a longer time frame for shareholder evaluation of board and managerial performance. This is consistent with our conclusion that temporary board protection might increase the efficiency of compensation plans by ensuring that shareholder and market discipline take place periodically, rather than “at all times.”
III. Organizations, Markets, and CEO Pay
In this Part, we seek to incorporate the above theoretical insights in the empirical investigation of the relationship between corporate governance features—and in particular board defenses—and competitive market forces, on the one hand, and CEO pay levels and structure, on the other. Our primary interests are the two issues that any explanation of executive compensation is called to address: the increase in executive-pay levels over time and the changes in the structure of pay over time.[122]
In developing our empirical investigation of CEO pay, we proceed through the following steps. In subpart A, we present our dataset. In subpart B, we provide a brief description of the time trends in average CEO pay over the past twenty-three years. In subpart C, in order to better understand the implications of board protection for incentive design, we focus on the relationship between defensive measures and executive pay. Lastly, in subpart D, we turn to examine the relationship between different forms of competition—namely, competition in the product and labor markets, as well as competition arising out of M&A activity—and executive pay.
Our universe of firms includes all firms in the ExecuComp database for the years 1993–2015, [123] excluding firms with dual-class stock and firms in regulated industries. Our final dataset consists of 18,511 firm-year observations for a total of 1,929 firms.
In examining executive compensation, we focus on four measures: CEO Pay, Equity Portion, Option Portion, and Stock Portion.[124] CEO Pay is measured as the natural logarithm of total CEO pay as reported in ExecuComp and is a proxy for the overall compensation payments received by the firm’s top executives—whether in the form of salary, bonuses, other annual compensation components, restricted stock grants, long-term incentive plans, option grants, or any other form of compensation. Equity Portion is the percentage of the CEO’s total compensation that is equity-based, including both restricted stock and option grants. Option Portion is the percentage of executive pay that is provided in the form of option grants, and Stock Portion is the percentage of executive pay that is provided in the form of restricted stock grants, where the sum of Option Portion and Stock Portion equals Equity Portion.
Further, we use two proxies for the equity-based incentives of the CEO’s current stock and option holdings: Pay-Performance Sensitivity (PPS) and Pay-Performance Volatility (PVS).[125] PPS measures the sensitivity of the CEO’s total equity holdings,[126] including both stock holdings and all options currently owned, to stock price.[127] That is, PPS measures how much the CEO’s wealth increases upon a 1% increase in stock value (or, alternatively, how much it decreases upon a 1% decrease in stock value). Accordingly, this measure can be interpreted as capturing the degree of alignment between shareholder and manager interests, so that a higher PPS indicates a closer alignment of interests between shareholders and managers.
PVS measures the sensitivity of the CEO’s current total option holdings to stock-return volatility. That is, PVS measures how much the value of the CEO’s total portfolio of stock options increases with a 1% increase in the annualized stock-return volatility (or, alternatively, how much the CEO’s wealth decreases with a 1% decrease in the firm’s annualized stock-return volatility). Accordingly, PVS can be interpreted as capturing the “power” of executive incentives or, more practically, the level of “optionality” of incentives.[128]
For the data on corporate governance features, we use several sources. Data on defensive measures—Staggered Board and Poison Pill—for 1993–2015 come from RiskMetrics, SharkRepellent.net, and hand collection. Staggered Board is an indicator variable equal to one if the firm has a board that is staggered (zero otherwise). Similarly, Poison Pill is an indicator variable equal to one if the firm has a poison pill in place (zero otherwise).
In addition to investigating defensive measures, we also examine Institutional Ownership, which measures the percentage of outstanding shares held by institutional investors. Indeed, institutional investors could potentially play an important role in monitoring the executive-pay process.[129] We obtain data for Institutional Ownership from Thomson Reuters (for institutional ownership data) and from the Center for Research in Security Prices (CRSP) database (for the number of outstanding shares).
For investigating the effects of competition, we use several proxies and several sources. As a proxy for the level of labor-market competition for managerial talent, we use Talent Competition. This measure is based on the research of Xavier Gabaix and Augustin Landier, who show that general matching models (explaining which CEOs end up at which firms) imply that executive compensation is increasing with both the size of the CEO’s firm and the general size of other firms in the economy.[130] On the one hand, CEO talent becomes more valuable to the firm as the firm becomes larger; on the other hand, as other firms become larger, stronger competition for scarce managerial talent bids up compensation for the most talented managers. Accordingly, Talent Competition is measured as the natural logarithm of the market capitalization of the outstanding shares of the 250th ranked firm in terms of market capitalization,[131] with data obtained from CRSP. Increases in the market capitalization of this reference firm indicate increased competition for managerial talent.[132]
To capture product-market competition, Product Competition, we use the Herfindahl–Hirschman concentration index, with data obtained from the Compustat annual data file. The Herfindahl–Hirschman index is a measure of industry concentration[133] based on sales (using all publicly traded firms in the industry).[134] For convenience, we present Product Competition as the negative of the Herfindahl–Hirschman concentration index, so that a lower Herfindahl–Hirschman index indicates a lower industry concentration and hence higher Product Competition.
Further, we also employ M&A Competition, which is a proxy for the level of M&A activity per industry.[135] We retrieve data for M&A Competition from the SDC Platinum database offered by Thomson Reuters, which provides comprehensive information on all M&A activity in the United States. The rationale behind the use of this measure is that the level of M&A activity captures the level of an industry’s shareholder pressure as operating through the takeover channel.[136]
Lastly, we add a set of standard controls, including leverage (Leverage), the ratio of capital expenditures over the book value of total assets (CAPX/Assets), the ratio of research and development expenditures over sales (R&D/Sales), an indicator variable for whether the firm is incorporated in Delaware (Delaware Incorporation), and the firm’s profitability (Profitability). Appendix Tables A–B provide a brief definition of all our variables,[137] while descriptive statistics are presented in Appendix Table C.
B. Time Trends in CEO Pay Level, Structure, and Incentives
We begin our empirical investigation by providing a description of the time trends in average CEO pay over the past twenty-three years. To this end, Figure 1 below shows the level and composition of average CEO pay in S&P 1500 firms for the period 1993–2015.[138] In particular, for each year, the figure shows the average level of three different components of executive compensation. The first is Non-Equity Pay, which includes salary, bonuses, and other forms of deferred compensation—essentially capturing the fixed component of executive compensation. We then have Stock Pay, which reflects the value of restricted stock grants, and lastly, Option Pay, which provides the average value of annual option grants.
Figure 1
Average CEO Pay 1993–2015
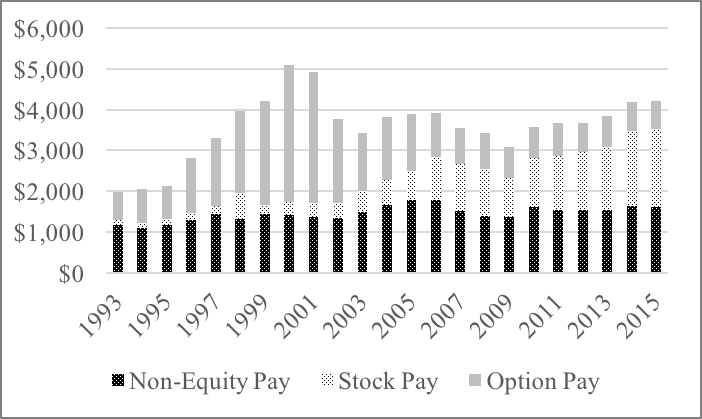
As shown in Figure 1, most of the dramatic increase in the level of CEO pay from the early 1990s to the early 2000s can be attributed to an escalation in Option Pay. The average Option Pay grew from $0.69 million in 1993 to $3.22 million in 2001, amounting to an increase of $2.53 million. In contrast, Non-Equity Pay only registers a growth of $0.21 million over the same nine-year period.
Notably, what caused the growth in the use of stock options is a challenging, and multifaceted, question. Commentators, however, tend to agree that the modification by the Clinton Administration, in 1993, of the tax code (which ironically was meant to reduce the level of CEO pay) offers at least a partial explanation, as the introduction of a $1 million deductibility cap for executive compensation with the exception of stock options[139] helped to provide a favorable tax treatment for options.[140]
Beginning in 2003, and even more since 2004, we observe a substantial shift away from Option Pay to Stock Pay, which progressively increases in the years afterward, with average Option Pay falling to $0.70 million and average Stock Pay swelling to $1.9 million by 2015.
This trend away from Option Pay to Stock Pay can partly be attributed to the introduction of a new, and less favorable, accounting treatment of options.[141] Indeed, the corporate scandals of the early 2000s renewed pressures for changing old accounting rules that permitted avoiding option expensing.[142] Under this pressure, many companies began voluntarily to transition to a regime of option expensing.[143] In response, in December 2004, the Financial Accounting Standards Board (FASB)—the private regulator responsible for standards of financial accounting and reporting in the United States—introduced a new accounting standard, FAS123(R) (revising rule FAS123),[144] under which the expensing rule for stock options became similar to that in place for restricted stock since 1972.[145] The new rule requires all U.S. public companies to recognize an accounting expense corresponding to the grant-date value of the shares amortized over the period when the options are not exercisable.[146] This change “significantly leveled the playing field between stock and options from an accounting perspective,”[147] plausibly inducing companies to increasingly substitute Option Pay with Stock Pay.
Next, we more closely examine the changing structure of equity-based compensation in Figure 2, which presents the proportions of stock-based executive pay and option-based executive pay (called, respectively, Stock Portion and Option Portion) in CEO compensation each year for all S&P 1500 companies in our sample for 1993–2015.
Figure 2
Stock Portion and Option Portion
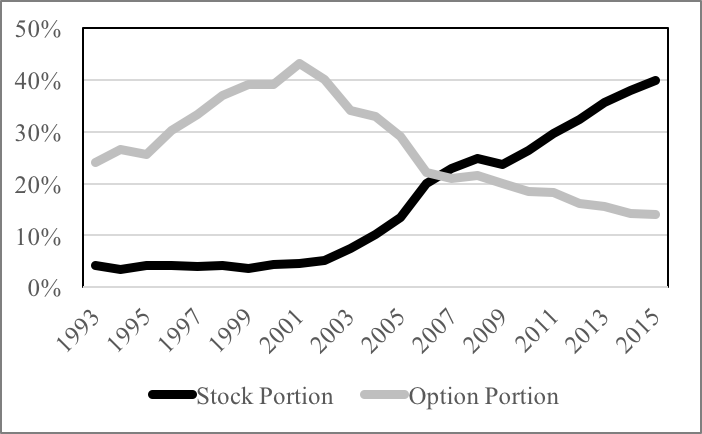
Figure 2 confirms that companies have been increasingly replacing options with stock grants in recent years. While Option Portion increased from about 24% in 1992 to 43% by 2001, it then fell to 22% in 2005 and then further to 14% in 2015. Conversely, the percentage of Stock Portion remained stable at around 5% from 1993 to 2002, then began to slowly increase in 2003 (when it went up to 8%) and more so in the years afterwards, reaching a percentage of 20% in 2006 and then surpassing the percentage of options in 2007 (i.e., 23% versus 21%). The gap in the use of Stock Portion relative to Option Portion further increased in the following years, with Stock Portion swelling to 40% and Option Portion declining to below 15% of total CEO pay by 2015.
Moving to the core of our empirical analysis, in this subpart we examine the relationship between corporate governance features—focusing on board defenses—and executive-compensation levels, structure, and incentives. As discussed above, under managerial power theory, such defenses provide the central means through which directors are insulated from the shareholders’ power of removal and hence captured by managers.[148] Conversely, under our dynamic approach to executive compensation, temporary board protection from shareholder discipline serves a positive governance function. This function is mitigating the risk that the shareholders’ limited commitment problem might strengthen a manager’s incentives toward short-termism and impair a board’s ability to design pay schemes that can efficiently induce managers to focus on long-term value creation.[149]
These opposite views of the relationship between board protection and executive compensation yield contrasting predictions. Under managerial power theory, one would expect to find that the adoption of defensive measures increases the likelihood that managers may extract inefficient entrenchment rents. This could happen, for example, through the overuse of fixed compensation or through a lower pay-for-performance sensitivity of the CEO pay package, which could take the form of a preference for the use of restricted stock grants over option grants.
On the contrary, under our dynamic approach to executive compensation, board protection is instrumental to efficient bargaining. As a result, our approach does not necessarily predict any change in the CEO pay packages of firms depending on their level of defensive measures. In other words, the dynamic approach suggests that whether or not we observe changes in these firms’ CEO pay packages, such changes (or lack thereof) should be generally regarded as the result of optimal contracting and hence, on average, as value increasing.
Therefore, our empirical investigation in this subpart is more concerned with the explanatory power of managerial power theory, while we will empirically investigate our theoretical predictions about board protection in Part IV below, which focuses on financial value analysis. We also note that prior studies have challenged managerial power theory from an empirical perspective; for example, as discussed above, documenting an improvement in the indicators of board independence or an increase in CEO turnover rates.[150] However, very few studies have directly examined the relationship between the use of defensive measures and executive compensation.[151]
Empirically, we proceed, in Table 1 below, by investigating the time-series association between Staggered Board and Poison Pill and the proxies described above for, respectively, the level (CEO Pay) and the structure (Equity Portion, Stock Portion, and Option Portion) of annual executive compensation, as well as the cumulative incentives of the executive’s current total holdings of stocks and options (PPS and PVS). As is well known in the literature, the advantage of using a time-series analysis is that of capturing intertemporal variation within the same firm—rather than across firms, as in cross-sectional analysis—with the result that time-series analysis is better placed to mitigate endogeneity concerns.[152]
In addition to our standard controls (which we do not show for the sake of brevity), in Table 1 we also control for Institutional Ownership. This control is meant to verify the prediction of managerial power theory that managers should be less able to extract inefficient entrenchment rents in firms with more institutional investors, as these investors can arguably count on more powerful governance levers to discipline directors and managers. We further include interactions between Staggered Board, Poison Pill, and Institutional Ownership with Post 2010, an indicator variable equal to one if the fiscal year included in the analysis falls after 2010 (zero otherwise). This additional test is meant to capture any variation in executive-compensation patterns that might have followed the 2010 enactment of the Dodd-Frank Act. Indeed, under managerial power theory, the Act’s introduction of measures favoring an enhanced role for shareholders in the pay-setting process, such as say-on-pay shareholder votes, should arguably have reduced inefficient entrenchment rents.
Table 1
CEO Pay and Corporate Governance
In this table, we present pooled panel regressions of six proxies for the level, structure, and incentives of the CEO’s compensation package (CEO Pay, Equity Portion, Stock Portion, Option Portion, PPS, PVS; see Appendix Table A for descriptions) on Staggered Board and Poison Pill plus a set of control variables (Institutional Ownership, Assets, Stock-Return Volatility, Leverage, Delaware Incorporation, Profitability, CAPX/Assets, R&D/Sales; see Appendix Table B for descriptions). Coefficients on the controls are not shown to save space, except for Institutional Ownership. We further include interactions between Staggered Board, Poison Pill, and Institutional Ownership with Post 2010, which is an indicator variable equal to one for years after 2010 (zero otherwise). All specifications include year and firm fixed effects (not shown). Statistical significance of the coefficients is indicated at the 1%, 5%, and 10% levels by ***, **, and *, respectively, based on robust standard errors clustered by firm.
| Dep. Variable: | CEO Pay | Equity Portion | Stock Portion | Option Portion | PPS | PVS |
| Variables | (1) | (2) | (3) | (4) | (5) | (6) |
| Staggered Board | -0.0127 | -0.0139 | -0.0141 | 0.0001 | -0.0559 | -0.2150** |
| (-0.37) | (-1.04) | (-1.15) | (0.01) | (-0.78) | (-2.09) | |
| Poison Pill | 0.0213 | -0.0060 | -0.0068 | 0.0008 | -0.0976** | 0.0461 |
| (1.03) | (-0.74) | (-0.97) | (0.09) | (-2.45) | (0.87) | |
| Institutional Ownership | 0.418*** | 0.134*** | -0.0309 | 0.165*** | 0.400*** | 0.845*** |
| (5.59) | (4.84) | (-1.50) | (6.19) | (2.76) | (4.78) | |
| Staggered Board | 0.0171 | -0.00243 | -0.0179 | 0.0155 | -0.00461 | 0.142 |
| Post 2010 | (0.59) | (-0.21) | (-1.37) | (1.27) | (-0.07) | (1.35) |
| Poison Pill | -0.0174 | 0.0188 | 0.00718 | 0.0116 | 0.0956 | 0.214** |
| Post 2010 | (-0.52) | (1.41) | (0.43) | (0.72) | (1.15) | (1.99) |
| Institutional Ownership | 0.164 | -0.000758 | 0.156*** | -0.157*** | 0.486* | 0.285 |
| Post 2010 | (1.62) | (-0.02) | (3.50) | (-3.91) | (1.80) | (0.71) |
| Fixed Effects | Firm,Year | Firm,Year | Firm,Year | Firm,Year | Firm,Year | Firm,Year |
| N | 18,613 | 18,613 | 18,613 | 18,613 | 17,790 | 18,253 |
| Adjusted R-Squared | 0.752 | 0.458 | 0.566 | 0.475 | 0.744 | 0.715 |
As shown in Table 1, we find no significant changes in CEO Pay (shown in Column 1), Equity Portion (shown in Column 2), Stock Portion (shown in Column 3), Option Portion (shown in Column 4), and PPS (shown in Column 5) of firms with a staggered board relative to firms without a staggered board. The only compensation variable for which we find a significant change in firms with a staggered board is PVS (shown in Column 6), whose negative coefficient indicates that having a staggered board is associated with less powerful equity incentives.
Similarly, in the case of Poison Pill, we find no significant changes in any compensation proxy, except PPS (shown in Column 5). As PPS measures the sensitivity of the CEO’s total equity holdings to stock price, this result could be taken to suggest that executive-compensation schemes in firms with a poison pill are less successful in aligning manager and shareholder interests. Yet, empirical difficulties and incongruences warn against this interpretation. First, since a board of directors can unilaterally adopt a pill at any time, it is difficult to gather any inference about the use of “visible” rather than “shadow” (or “off-the-rack”) pills.[153] Second, even though we observe a lower sensitivity of pay to performance in firms with a poison pill, we cannot tell whether this change is inefficient, as we have not yet verified its effects on firm value. Third, we observe that Poison Pill is not associated with any significant change in Equity Portion, which makes it complicated to understand where the reduction in PPS comes from.
Taken as a whole, the results on Staggered Board and Poison Pill in Table 1 seem incompatible with managerial power theory, as there is no evidence that having these defenses in place results in higher levels of executive compensation or changes in pay structure.
On the contrary, these results seem compatible with our dynamic approach and the managerial talent hypothesis, as this approach does not necessarily predict any change in the CEO pay packages of firms depending on their level of defensive measures. Indeed, this approach recognizes that the level and structure of CEO pay, as well as the level of takeover defenses, investment policy, and the firm’s overall strategy are simultaneously chosen, depending on the firm’s specific circumstances (including both the firm’s current performance as well as expectations of future performance) and the level of competition the firm faces in the product market and managerial talent market.
Our results on Institutional Ownership also seem incompatible with managerial power theory, as we find that the level of CEO Pay (shown in Column 1) is higher in firms with more institutional investors, contrary to the view that such investors would be better placed to rein in allegedly inefficient executive pay. We also find that Institutional Ownership is associated with a statistically significant increase in Equity Portion (shown in Column 2) and both PPS and PVS (respectively shown in Columns 5 and 6). In particular, the positive association between Equity Portion and Institutional Ownership seems to be driven by the use of options, as Option Portion has a large positive and statistically significant association with Institutional Ownership (shown in Column 4), while Stock Portion is negatively associated with Institutional Ownership (although the coefficient, shown in Column 3, is not statistically significant). These results suggest that firms with more institutional investors prefer the adoption of more-skewed incentive schemes.
Again, while we cannot yet tell whether more-skewed incentives generally serve shareholder interests, it is important to emphasize that managerial power theory predicts that such incentives should be associated with a reduction—rather than an increase—in overall CEO pay. This is because providing managers with more-skewed incentives (that is, options) should constitute a less costly way of paying a manager’s agency rents.[154] Our data, however, seem to indicate otherwise, as Institutional Ownership has a strongly positive and statistically significant relationship with the level—and not just the structure—of executive compensation.
When we control for possible changes that might have occurred in executive-compensation trends after the 2010 introduction of the Dodd-Frank Act (Post 2010), we obtain results that are in line with our considerations above for each of the variables of interest. First, having a staggered board in place after 2010 is not associated with any statistically significant change in executive compensation. Second, in firms with a poison pill in place after 2010, the only statistically significant change is an increase in PVS (shown in Column 6). Yet, the above considerations on the difficulty of interpreting Poison Pill results also apply here. Third, concerning the post-2010 impact of Institutional Ownership on executive compensation, we document a statistically significant increase of Stock Portion (shown in Column 3), accompanied by a statistically significant decrease of Option Portion (shown in Column 4). This seems to suggest that the 2010 executive-compensation reform has possibly contributed to producing a shift from Option Portion to Stock Portion in firms with more institutional investors.
When coupled with the additional evidence that this shift has increased, rather than decreased, PPS, the results on the post-2010 impact of Institutional Ownership on executive compensation seem incompatible with the managerial power view that the payment to the executive of restricted stock, rather than options, should be regarded as a form of entrenchment rent that is detrimental to shareholder interests. Otherwise, why would we observe that firms with more institutional investors have chosen to increasingly substitute Stock Portion for Option Portion after such investors were empowered with a greater say in the CEO pay process? Additionally, why would we find that this substitution improves the alignment of shareholder and manager interests?
To sum up, the results of Table 1 suggest that board decision-making concerning the CEO pay process is better explained by external governance factors, such as the presence of institutional investors, than by internal governance arrangements, such as the adoption of a staggered board or a poison pill. This conclusion is not just difficult to reconcile with managerial power theory, but it directly points to a role for market forces in the CEO pay process. We turn to the empirical investigation of that role next.
D. Product, Financial, and Labor Markets
In this subpart, we aim to explore what role market forces and competition play in shaping CEO pay levels, structure, and incentives. To this end, Table 2 presents pooled panel regressions (with firm fixed effects but no year fixed effects)[155] of three proxies of competition—Talent Competition, Product Competition, and M&A Competition—on CEO pay levels, structure, and incentives. As explained in our data description,[156] each of these competition proxies is designed to capture different market forces that may play a role in shaping executive compensation. Drawing on managerial talent theory, our primary interest is on labor-market competition for managerial talent (Talent Competition). Secondarily, we are interested in understanding whether competition in the product market (Product Competition) or competition in the M&A market (M&A Competition, which we interpret as a measure capturing the level of shareholder pressure in a given industry) have any role to play in the executive-pay process.
Table 2:
CEO Pay and Competition
In this table, we present pooled panel regressions of six proxies for the level, structure, and incentives of the CEO’s compensation package (CEO Pay, Equity Portion, Stock Portion, Option Portion, PPS, and PVS; see Appendix Table A for descriptions) on three proxies for market competition (Talent Competition, Product Competition, and M&A Competition; see Appendix Table B for descriptions). We further include Market Cap, i.e., the natural logarithm of the market capitalization of the outstanding shares of the firm, plus a set of standard controls (Assets, Stock-Return Volatility, Leverage, Delaware Incorporation, Profitability, CAPX/Assets, and R&D/Sales; see Appendix Table B for descriptions). Coefficients on the controls are not shown to save space (except for Market Cap and Assets). All specifications include firm fixed effects (also not shown). Statistical significance of the coefficients is indicated at the 1%, 5%, and 10% levels by ***, **, and *, respectively, based on robust standard errors clustered by firm. For Talent Competition and M&A Competition, we cluster by year, as this results in more conservative (i.e., smaller) t-statistics.
| Dep. Variable: | CEO Pay | Equity Portion | Stock Portion | Option Portion | PPS | PVS |
| Variables | (1) | (2) | (3) | (4) | (5) | (6) |
| Talent Competition | 0.341*** | 0.102*** | 0.0908*** | 0.0116 | 0.173 | 0.695*** |
| (7.04) | (5.69) | (2.84) | (0.34) | (1.21) | (3.39) | |
| Product Competition | -0.421 | -0.306** | -0.751*** | 0.445*** | 1.377** | 0.835 |
| (-1.40) | -(2.49) | (-5.35) | (3.18) | (2.25) | (0.75) | |
| M&A Competition | 0.00619 | 0.0143 | -0.117*** | 0.131*** | 0.420*** | 0.638*** |
| (0.12) | (0.48) | (-1.88) | (1.87) | (2.78) | (1.90) | |
| Market Cap | 0.0857*** | 0.0449*** | -0.0371*** | 0.0820*** | 0.288*** | 0.121*** |
| (5.21) | (7.56) | (-6.88) | (12.36) | (10.85) | (3.15) | |
| Assets | 0.295*** | 0.0230*** | 0.120*** | -0.0970*** | 0.0756* | 0.273*** |
| (13.52) | (2.88) | (14.46) | (-10.69) | (1.94) | (5.00) | |
| Fixed Effects | Firm | Firm | Firm | Firm | Firm | Firm |
| N | 18,692 | 18,692 | 18,692 | 18,692 | 17,871 | 18,309 |
| Adjusted R-Squared | 0.729 | 0.446 | 0.479 | 0.430 | 0.721 | 0.672 |
Table 2 shows that Talent Competition has a substantial effect on executive compensation. First, greater Talent Competition is associated with a statistically significant increase in CEO Pay (shown in Column 1), supporting the prediction of managerial talent theory that increasingly higher CEO pay levels can be largely explained in terms of market rents.[157] The magnitude of the association between the level of competition for managerial talent and the various aspects of CEO pay also is economically meaningful. For example, a standard deviation increase in Talent Competition[158] is associated with an increase in CEO Pay of 0.14[159] which constitutes about 14.1% of the standard deviation in CEO Pay. Overall, the results in Table 2 on the association between Talent Competition and CEO Pay thus seem to suggest that the explosion in CEO pay is more likely to be the result of competitive forces than a dramatic increase in the managerial moral hazard problem.[160]
Talent Competition is also positively associated with a statistically significant increase in Equity Portion (shown in Column 2), Stock Portion (shown in Column 3), and PVS (shown in Column 6). The coefficients on Option Portion (shown in Column 4) and PPS (shown in Column 5) are also positive but not statistically significant. Thus, the increase in CEO pay levels due to competition in the managerial labor market seems largely attributable to an increase in the stock component of CEO pay. In other words, restricted stock grants emerge as the most common way of paying out the market rents demanded by increased competition for managerial talent.
Conversely, greater Product Competition is associated with a decrease of CEO Pay (shown in Column 1, though statistically insignificant) and Stock Portion (shown in Column 3, and strongly statistically significant). Possibly, the negative association between competition in the product market and executive compensation might be explained by the fact that firms in more competitive industries tend to be less profitable, which would justify an average CEO pay that is lower. At the same time, greater Product Competition is associated with an increase in both Option Portion (shown in Column 4) and PPS (shown in Column 5). The coefficient on PVS (shown in Column 6) is also positive but not statistically significant. Consistent with our earlier assumptions,[161] this result could be explained by the fact that firms in more competitive industries are continuously required to outperform their competitors, which could justify why such firms have a preference for more-skewed incentives.
The results for M&A Competition are quite similar to those for Product Competition, except that M&A Competition is not associated with any significant change in CEO Pay (shown in Column 1) and is positively and significantly associated with PVS (shown in Column 6). This finding also seems consistent with our assumption that firms that are subject to greater shareholder pressure might prefer skewed incentives to promote positive short-term performance and, therefore, reduce the likelihood of a future takeover and other short-term shareholder interferences.[162]
Combined, the results on Product Competition and M&A Competition indicate that greater market discipline (whether in the form of intense product-market competition or enhanced shareholder pressure) produces an increase in the sensitivity of pay to performance through the use of less pay in the form of restricted stock and more in the form of option grants. Indeed, the evidence that Option Portion increases, while Stock Portion decreases points to a substitution effect between Option Portion and Stock Portion. In contrast, greater Talent Competition has the opposite effect of increasing Stock Portion. However, we cannot tell yet which of these effects is efficient. It could be that decreasing stock and increasing options enhances shareholder value, as suggested by managerial power theorists,[163] or, on the contrary, that increasing stock can better serve shareholder interests by mitigating short-term preferences, which would be consistent with our dynamic approach. To answer this and additional questions, we move to the value analysis of executive compensation.
This Part examines the interacted impact on firm value of corporate governance features, competition, and executive compensation. Two main research interests motivate this additional analysis. First, our investigation of the empirical relationship between defensive measures and executive compensation seems incompatible with the managerial power view that strong defenses, such as the staggered board, are the main source of inefficient entrenchment rents, as we document that staggered boards are not associated with any of the executive-compensation patterns predicted by this view. Per se, however, this analysis does not give us information on how defensive measures interact with executive compensation to impact firm value. Our hypothesis is that once one considers the complexities arising from competition and the dynamic nature of executive-compensation contracts, the use of defensive measures might be instrumental to promoting optimal bargaining between boards and managers.
Second, and relatedly, our theoretical and empirical analysis of the relationship between competition and executive-compensation points to a major impact of various forms of talent, product, and M&A competition on both CEO pay levels and structure. Therefore, for each of these forms of competition, we are interested in understanding whether its impact on executive compensation also produces an impact on firm performance and what kind of impact it may produce.
Of course, we are aware of the endogeneity concerns that such investigation might raise, which a time-series analysis can mitigate but not fully address. Indeed, firm performance and CEO pay are jointly determined, which makes it difficult to understand the direction of causality, if any, in the relationship between these variables. In response to such concerns, Part IV also considers an event study that focuses on the 2005 introduction of the FAS123(R) mandate to expense stock options.[164] As the product of regulatory intervention, this event can be regarded as independent from firm-specific circumstances and, hence, as plausibly inducing exogenous changes in both the levels and structure of CEO pay. Therefore, examining the subsequent performance of firms that were and were not affected by the introduction of FAS123(R) can arguably provide causal evidence about the impact of modifications in CEO pay levels and structure on firm value. Further, as FAS123(R) leveled the playing field between the use of options and restricted stock from an accounting perspective, we expect such an event study to provide us with additional insights into the relative efficiency of more versus less skewed compensation arrangements.
Table 3 presents time-series results for our value analysis of executive compensation.[165] As a proxy for firm value, we use Tobin’s Q (Q) (the ratio of a firm’s market value of assets to its book value of assets) as it has become standard in the empirical literature.[166] Because firm valuations are generally strongly related to market-wide movements, in addition to firm fixed effects, we also include year fixed effects. This, in turn, prevents us from including Talent Competition in our value analysis, as this proxy corresponds to the market cap of the 250th firm in the S&P 500 and, thus, only varies by year. We note, however, that as Talent Competition seems to constitute a primary source of the increase in CEO pay levels, testing the value association of changes in the level of CEO Pay with changes in firm value provides indirect information on the efficiency implications of labor-market competition for managerial talent.
Table 3
CEO Pay and Firm Value
In this table, we present pooled panel Q regressions on one-year lagged values of proxies for the level, structure, and incentives of CEO pay (CEO Pay, Equity Portion, PPS, and PVS; see Appendix Table A for descriptions), corporate governance (Staggered Board and Poison Pill), competition (Product Competition and M&A Competition), and a set of standard controls (Assets, Stock-Return Volatility, Leverage, Delaware Incorporation, Profitability, CAPX/Assets, and R&D/Sales). See Appendix Table B for all non-compensation variable descriptions. In Columns 5 and 7, we add the interactions of Staggered Board and Poison Pill with CEO Pay, and in Columns 6 and 7, we further add the interactions of Product Competition and M&A Competition with CEO Pay. Coefficients on the standard controls are not shown to save space. All specifications include firm and year fixed effects (also not shown). Statistical significance of the coefficients is indicated at the 1%, 5%, and 10% levels by ***, **, and *, respectively, based on robust standard errors clustered by firm.
| Dep. Variable: Firm Value (Q) | |||||||
| Variables (Lagged) | (1) | (2) | (3) | (4) | (5) | (6) | (7) |
| CEO Pay | 0.100*** | 0.134*** | 0.0946*** | 0.0524 | 0.0871** | 0.0344 | |
| (4.35) | (4.80) | (3.81) | (1.49) | (2.55) | (0.78) | ||
| Equity Portion | -0.132** | -0.0329 | |||||
| (-2.56) | (-0.66) | ||||||
| PPS | 0.193*** | 0.186*** | |||||
| (13.30) | (12.76) | ||||||
| PVS | -0.0675*** | -0.0749*** | |||||
| (-5.65) | (-6.42) | ||||||
| Staggered Board | 0.0565* | 0.0577* | |||||
| CEO Pay | (1.74) | (1.78) | |||||
| Poison Pill | 0.0321 | 0.0348 | |||||
| CEO Pay | (1.20) | (1.30) | |||||
| Product Competition | -0.288 | -0.329 | |||||
| CEO Pay | (-1.12) | (-1.28) | |||||
| M&A Competition | -0.220** | -0.230** | |||||
| CEO Pay | (-2.02) | (-2.10) | |||||
| Staggered Board | 0.179*** | 0.177*** | 0.184*** | 0.185*** | -0.305 | 0.181*** | -0.312 |
| (2.93) | (2.92) | (3.32) | (3.38) | (-1.14) | (2.99) | (-1.18) | |
| Poison Pill | -0.0285 | -0.0295 | 0.00591 | 0.00478 | -0.287 | -0.0275 | -0.308 |
| (-0.84) | (-0.87) | (0.18) | (0.15) | (-1.33) | (-0.82) | (-1.42) | |
| Product Competition | 0.566 | 0.568 | 0.369 | 0.383 | 0.513 | 1.774 | 2.166 |
| (1.23) | (1.24) | (0.84) | (0.88) | (1.12) | (0.88) | (1.07) | |
| M&A Competition | -0.154 | -0.152 | -0.192* | -0.189* | -0.156 | 1.589* | 1.658* |
| (-1.56) | (-1.55) | (-1.94) | (-1.90) | (-1.58) | (1.84) | (1.92) | |
| Fixed Effects | Firm,Year | Firm,Year | Firm,Year | Firm,Year | Firm,Year | Firm,Year | Firm,Year |
| N | 17,905 | 17,905 | 17,112 | 17,071 | 17,905 | 17,905 | 17,905 |
| Adjusted R-Squared | 0.707 | 0.708 | 0.720 | 0.722 | 0.708 | 0.707 | 0.708 |
As shown in Table 3, Column 1, higher CEO Pay is associated with higher firm value. For example, multiplying the coefficient in Column 1 of 0.100 with the standard deviation of CEO Pay (equal to 0.998) suggests that one standard deviation increase in executive pay is associated with a future and permanent increase in firm value of about 0.10, which amounts to an increase of about 6.5% of the median firm value in the sample.[167]
The positive association between CEO pay levels and firm value seems inconsistent with the notion that a large portion of CEOs receive substantially “excessive” levels of pay in the sense described by managerial power theory.[168] Indeed, under such a theory, we would have expected a negative association between increased CEO pay levels and firm value.
Of course, CEO Pay in Table 3 is determined endogenously along with firm value so that causation can run both ways rather than just from CEO Pay to firm value. In other words, enhanced CEO effectiveness could result in higher CEO pay rather than higher pay causing better performance. We address endogeneity concerns in the next section. Still, it is worth observing here that to the extent that causation runs from firm value to CEO Pay, this result would still be more consistent with managerial talent theory and our dynamic approach to executive compensation than with managerial power theory. Indeed, when considered in combination with the results of Table 2 on Talent Competition, high CEO pay levels seem to largely reflect market rents that are necessary to ensure that the most talented CEOs are allocated to the most valuable firms, consistent with the claims of managerial talent theory.[169] Further, the positive association between CEO Pay and higher long-term firm value also seems consistent with our dynamic approach, under which granting managers high rents may help commit talented managers to the exercise of long-term effort and, therefore, increase long-term shareholder wealth.[170]
Next, Column 2 shows that a higher Equity Portion is associated with a statistically significant reduction in firm value.[171] Combined with the results we obtain for PPS and PVS respectively (shown in Column 3), this suggests that the source of reduced firm value is not the provision of equity incentives per se, but rather the provision of equity incentives that are excessively skewed (that is, a higher Option Portion), as a higher PVS is associated with lower firm value, while a higher PPS is associated with higher firm value.
This is consistent with our theoretical prediction about the effects of intertemporal tradeoffs and the related risk of short-termism.[172] Given this risk, providing managers with more powerful incentives (more options and less restricted stock) may decrease, rather than increase, shareholder wealth. Indeed, such incentives may induce managers to prefer short-termist investment projects at the expense of long-term firm value, possibly explaining why a higher PVS is associated with lower firm value in Table 3.
The results of the interacted impact of CEO Pay with Staggered Board and Poison Pill respectively (shown in Column 5) are also consistent with our theoretical predictions. Combining a staggered board with high CEO pay is associated with higher firm value, consistent with our theory that the adoption of a staggered board might serve a positive function in the executive-compensation context.[173] Indeed, while neither staggered boards nor poison pills are associated with statistically significant changes in either the level or structure of CEO pay,[174] the results of Table 3 are strongly suggestive that firms with a staggered board have more efficient CEO pay (that is, the positive association between higher CEO Pay and higher firm value seems to be primarily driven by firms with a staggered board). Even if this is driven by selection, then it seems to be “good selection.”
Interpreted differently, adopting a staggered board seems to lead to—or at least be indicative of—a more positive relationship between CEO pay and firm value, suggesting that talented CEOs (who presumably receive higher pay) are more effective at firms with a staggered board. Our commitment theory provides a rational explanation for this result, suggesting that the staggered board can serve as a bilateral commitment device towards long-term value creation by both shareholders and managers, thereby mitigating the negative externalities arising from excessive market discipline or investor short-termism.[175] This, in turn, helps preserve a manager’s continuation value and the ability of boards to exploit such value for efficient incentive design.[176]
Our results for Poison Pill are in line with those for Staggered Board, although the increase in firm value associated with the combination of a poison pill and high CEO pay is not statistically significant. Overall, our results on the interacted impact of defensive measures and CEO pay on firm value thus seem to suggest that such measures complement the use of pecuniary incentives to promote long-term value creation.
Next, in Column 6, we examine the interacted impact of both Product Competition and M&A Competition with CEO Pay on firm value. We find that higher Product Competition is associated with lower firm value (although the association is not statistically significant). The coefficient on M&A Competition in Column 6 is similar, where a higher level of M&A activity per industry interacted with CEO Pay is associated with a statistically significant lower firm value.
These results are, again, consistent with our theoretical predictions, supporting the view that market forces such as greater product-market competition and increased shareholder pressure might introduce value-reducing distortions in incentive design. On the other hand, we also document that the stand-alone coefficient on M&A Competition is positive and statistically significant. This is consistent with the assumption that the higher likelihood of a future takeover increases firm value, as shareholders have a greater probability of selling their shares at a premium.[177] This expectation, however, comes at the cost of disrupting compensation schemes, further confirming that the benefits of greater market discipline need to be evaluated along with its cost.[178]
As hinted to above, the results of our value analysis need to be carefully interpreted due to possible endogeneity concerns. In particular, two of such concerns seem more severe. First, there could be important factors that affect both firm performance and executive compensation, which could result in a “specification problem.” Empiricists refer to such a problem when changes in the dependent variable might be attributable to factors other than changes in the independent variable.[179] For example, actual CEO talent is unobservable and may be time-varying. As a result, our finding that firm value tends to go up if CEO pay increases may at least partly reflect an enhanced CEO effectiveness over time.
Second, executive compensation and firm performance are jointly determined. This means that executive compensation affects firm performance, but firm performance also affects executive compensation, with the added complexity that some aspects of firm performance are unobservable to outsiders, although they are presumably observable to the board. This, in turn, may involve what empirical scholars refer to as a “reverse causality” problem, which arises when the dependent variable causes changes in the independent variable, rather than the other way around.[180] In our case, it could be that expectations of future outperformance might lead to increases in current compensation, based on the board’s observation that the CEO has been more effective than perhaps recognized by the shareholders. Therefore, the predictability in firm value that we document (where increases in the level of pay predict better future performance) may be due to improved CEO effectiveness that is not yet recognized by the stock market, that is, be due to reverse causality. As with possible specification issues affecting our results, however, it is worth emphasizing that the possibility of reverse causality does not go in the direction of supporting managerial power theory, as this theory falls short of predicting that CEO pay is largely driven by the board’s well-informed expectations about future performance.[181]
In response to these concerns, in this subpart we employ an event study, examining the effects on executive compensation and firm value of the exogenous changes produced by the 2005 introduction of the mandate to expense stock options, namely accounting standard FAS123(R).[182] As we document below, the results we obtain are consistent with the above interpretation of our value analysis as supporting the view that greater market and shareholder pressure might lead to value-reducing distortions in CEO pay, such as an overuse of option grants that place excessive emphasis on short-term performance at the expense of long-term firm value.
1. Identification Strategy.—As briefly discussed in subpart III(B), FAS123(R)’s mandate to expense stock options significantly reduced the attractiveness of stock options from an accounting perspective, leading most U.S. public companies to increasingly substitute option grants with restricted stock grants. It is important to emphasize, however, that FAS123(R) only impacted the accounting performance of firms, but did not directly affect corporate cash flows. Indeed, while firms granting larger option awards to their executives now bear higher accounting expenses (and, hence, lower net accounting profits), expensing stock options does not lead to any cash outflow at the time of the option award. That is, the cash flows associated with option awards remain unaltered. Therefore, FAS123(R) should not be expected to have directly affected long-term firm value or long-term shareholder value, as shareholders should ultimately only care about a firm’s cash flows rather than accounting performance.
Hence, our main identifying assumption is that FAS123(R) has arguably impacted firm value only indirectly, through the changes that it produced on the level and structure of CEO pay.[183] This means that any direct effect of FAS123(R) on firm value should be regarded as second-order, or minor, relative to the effect on firm value the rule produced through the changes it caused in the level and structure of executive compensation. Under these assumptions, the association between the changes in compensation that were caused by FAS123(R) and the changes in firm value that took place after the rule’s introduction can accordingly be interpreted as providing plausible causal evidence for how changes in compensation affect changes in firm value.
2. High-Powered Incentives: A Negative Result.—Our empirical analysis proceeds in two steps. In the first step, we consider how the level and structure of CEO pay changed in the two years before (fiscal years 2003 and 2004) versus after (fiscal years 2005 and 2006) the introduction of FAS123(R). In the second step, we consider how the changes in firm value occurring before versus after the introduction of FAS123(R) relate to the plausibly exogenous changes that companies made to the level and structure of their CEOs’ compensation in response to the new accounting rule.
In order to isolate compensation changes that were made in response to FAS123(R) from compensation changes made for other reasons, we always include firm fixed effects, year fixed effects, and the resulting impact on firm value. To the same end, we compare the changes in firm value and compensation for firms that were affected by the introduction of FAS123(R)—the “treated firms”—to a set of “control firms,” which did not award any options to their CEOs in either 2003 or 2004 and were therefore arguably unaffected by the introduction of FAS123(R) over the time period that we study (2003–2006). Thus, all our results for how FAS123(R) affected either compensation or firm value compare how specific changes affected the “treated firms” differently from the “control firms.” [184]
Table 4, Panel A presents the results for the first step of our analysis, essentially showing the effect of the mandate to expense stock options on CEO pay levels and structure.
Table 4, Panel A
CEO Pay Around the Introduction of FAS123(R)
In this table, we present pooled panel regressions of four proxies for the level, structure, and incentives of the CEO’s compensation package (CEO Pay, Equity Portion, Stock Portion, and Option Portion; see Appendix Table A for descriptions) in the four years (2003–2006) surrounding the introduction of the mandate to expense option grants starting in fiscal year 2005 (FAS123(R)) on Treated 2005–2006, plus proxies for competition, corporate governance, and the standard controls. Treated is an indicator variable equal to one if the firm awarded options to the CEO in 2003 or 2004, and 2005–2006 is an indicator variable that equals one in fiscal years 2005 and 2006. The included competition variables are Product Competition, M&A Competition, and Talent Competition; the included governance variables are Staggered Board and Poison Pill; and the set of controls includes Market Cap, Institutional Ownership, Assets, Stock-Return Volatility, Leverage, Delaware Incorporation, Profitability, CAPX/Assets, and R&D/Sales. See Appendix Table B for descriptions. We do not show the coefficients on some of the controls to save space. All specifications include year and firm fixed effects (not shown). Statistical significance of the coefficients is indicated at the 1%, 5%, and 10% levels by ***, **, and *, respectively, based on robust standard errors clustered by firm.
| Dep. Variable: | CEO Pay | Equity Portion | Stock Portion | Option Portion |
| Variables | (1) | (2) | (3) | (4) |
| Treated 2005–2006 | -0.296*** | -0.193*** | 0.0271 | -0.220*** |
| (-4.44) | (-7.69) | (1.60) | (-10.66) | |
| Staggered Board | -0.0105 | -0.0559 | -0.0463 | -0.00958 |
| (-0.10) | (-1.41) | (-1.31) | (-0.25) | |
| Poison Pill | -0.0449 | -0.0126 | -0.0190 | 0.00632 |
| (-0.72) | (-0.44) | (-0.77) | (0.20) | |
| Institutional Ownership | 0.00441** | 0.000950 | -0.000165 | 0.00111 |
| (2.04) | (1.08) | (-0.28) | (1.32) | |
| Talent Competition | 0.0718 | -0.177 | 0.466*** | -0.643*** |
| (0.27) | (-1.43) | (4.57) | (-5.96) | |
| Product Competition | -1.266 | -0.912 | -0.367 | -0.545 |
| (-0.81) | (-1.60) | (-0.88) | (-1.20) | |
| M&A Competition | -0.0155 | -0.0187 | 0.00241 | -0.0211 |
| (-0.12) | (-0.33) | (0.08) | (-0.47) | |
| Market Cap | 0.0375 | 0.0590*** | -0.0226 | 0.0817*** |
| (0.69) | (2.84) | (-1.46) | (3.86) | |
| Fixed Effects | Firm,Year | Firm,Year | Firm,Year | Firm,Year |
| N | 4,188 | 4,188 | 4,188 | 4,188 |
| Adjusted R-Squared | 0.845 | 0.630 | 0.576 | 0.676 |
As shown in Table 4, Panel A, Column 1, the introduction of FAS123(R) (that is, Treated 2005–2006) is associated with a statistically significant reduction in CEO Pay. In particular, as shown in Column 2, the reduction in CEO Pay is attributable to a statistically significant reduction of Equity Portion, which, unsurprisingly, can be exclusively attributed to a statistically significant decline of Option Portion (Column 4).[185] Indeed, while Stock Portion increases (at an almost significant level), such an increase is not sufficient to offset the decline in Option Portion, explaining the overall reduction in CEO Pay.
Next, Table 4, Panel B shows the results for the second step of our analysis, considering how firm value changed from before and after the introduction of FAS123(R), depending on one-year lagged changes in CEO compensation.
Table 4, Panel B
CEO Pay and Firm Value Around the Introduction of FAS123(R)
In this table, we present pooled panel Q regressions on one-year lagged values of proxies for the level and structure of the CEO’s compensation package (CEO Pay, Equity Portion, Stock Portion, and Option Portion; see Appendix Table A for descriptions) and their interaction with Treated and Treated 2005–2006. The time period for the independent (lagged) variables is 2003–2006. Treated is an indicator variable equal to one if the firm awarded options to the CEO in 2003 or 2004. We include Staggered Board, Poison Pill, and the set of controls (Institutional Ownership, Assets, Stock-Return Volatility, Leverage, Delaware Incorporation, Profitability, CAPX/Assets, and R&D/Sales). See Appendix Table B for descriptions. We do not show the coefficients on the controls to save space. All specifications include year and firm fixed effects (not shown). Statistical significance of the coefficients is indicated at the 1%, 5%, and 10% levels by ***, **, and *, respectively, based on robust standard errors clustered by firm.
| Dep. Variable: Firm Value (Tobin’s Q) | |||
| Variables (Lagged) | (1) | (2) | (3) |
| Treated 2005–2006 | 0.0350 | -0.151 | -0.0750 |
| (0.18) | (-0.78) | (-0.37) | |
| CEO Pay | -0.0286 | -0.0819 | -0.0830 |
| (-0.34) | (-0.85) | (-0.85) | |
| CEO Pay Treated | 0.114 | 0.151 | 0.155 |
| (1.32) | (1.49) | (1.52) | |
| CEO Pay Treated 2005–2006 | -0.0192 | 0.0228 | 0.0125 |
| (-0.85) | (0.94) | (0.50) | |
| Equity Portion | -0.105* | 0.109 | |
| (-1.68) | (0.54) | ||
| Equity Portion Treated | -0.0977 | ||
| (-0.45) | |||
| Equity Portion Treated 2005–2006 | -0.302*** | ||
| (-3.22) | |||
| Stock Portion | 0.0684 | ||
| (0.25) | |||
| Stock Portion Treated | -0.212 | ||
| (-0.73) | |||
| Stock Portion Treated 2005–2006 | -0.0434 | ||
| (-0.36) | |||
| Option Portion | 0.164 | ||
| (0.76) | |||
| Option Portion Treated | -0.143 | ||
| (-0.63) | |||
| Option Portion Treated 2005–2006 | -0.357*** | ||
| (-3.43) | |||
| Fixed Effects | Firm,Year | Firm,Year | Firm,Year |
| N | 4,188 | 4,188 | 4,188 |
| Adjusted R-Squared | 0.893 | 0.893 | 0.894 |
As shown in Table 4, Panel B—and consistent with our identifying assumption above—the introduction of FAS123(R) (that is, Treated 2005–2006) did not directly affect firm value (Columns 1 through 3). Similarly, CEO Pay per se did not affect firm value in our period (Columns 1 through 3). Further, as consistently shown by the interaction coefficient of CEO Pay Treated 2005–2006 (Columns 1 through 3), the changes in compensation levels attributable to the change in the accounting rule did not affect firm value. Consistent with the results we obtain in our value analysis in subpart IV(A) above, these results suggest that the overall level of compensation before the introduction of FAS123(R) was set “efficiently” on average, in the sense that compensation levels before the accounting rule modification do not seem to reflect “excessive rents” that fail to promote incentives for firm value maximization, as predicted by managerial power theory.[186]
Nonetheless, the triple interaction Equity Portion Treated 2005–2006 (in Column 2) has a large negative and statistically significant coefficient of –0.302. This means that the more firms affected by the introduction of FAS123(R) reduced the use of equity-based pay in the two years after the rule change, the greater the increase in firm value. Economically, the coefficient of Equity Portion Treated 2005–2006 indicates that a standard deviation decline in Equity Portion in affected firms is associated with an increase in firm value of 4.4%.[187] To the extent that these reductions in equity-based pay were caused by the introduction of FAS123(R) and were thus exogenous to firm-specific circumstances, this result points to an inefficiency in executive-compensation structure, indicating that firms had been paying their CEOs with excessive proportions of equity-based pay prior to the rule change.[188]
Most importantly, in Column 3, we find that the negative association between equity-based pay and firm value is driven by the negative association between option-based pay and firm value, rather than the association between stock-based pay and firm value. Specifically, the triple interaction Stock Portion Treated 2005–2006 has a small and insignificant coefficient, while the triple interaction Option Portion Treated 2005–2006 has a large negative and statistically significant coefficient of –0.357 (t-statistic of 3.43). Economically, this coefficient indicates that a standard deviation decline in Option Portion in the firms affected by the accounting rule change is associated with an increase in firm value of 5.1%.[189]
Thus, only reductions in option-based pay were associated with increases in firm value for the subset of firms affected by the introduction of FAS123(R).[190] This is consistent with a plausible causal interpretation of our event study, as Panel A of Table 4 documents that treated firms affected by the accounting rule change experienced a reduction in the use of option-based pay relative to control firms unaffected by such change, while the use of stock-based pay remained basically unchanged.[191]
To sum up, the main takeaway from our event study is that option-based pay seems to have been overused in recent years, which raises the question of what might have determined this distortion. Our results that greater product-market competition and shareholder pressure are associated with an increase in option-based pay (see results for M&A Competition in Table 2),[192] as well as the negative association of such market forces with firm value (see Table 3), point to a plausible answer. Taken together, and consistent with our theoretical predictions in subpart II(C), these results seem to indicate that the overuse of option-based pay can be at least partly attributed to distortions arising from excessive market and shareholder pressure. Indeed, boards of firms that were more exposed to such market forces may have felt forced to substantially increase option-based compensation that overemphasizes short-term performance, regardless of the long-term effects of such incentive design. To this extent, the results we obtain in Table 4, Panels A and B also support the hypothesis that long-term value creation requires a strong commitment from both managers and shareholders towards long-term cooperation. The results do so by indicating that such cooperation is less likely to take place in firms that are subject to excessive market pressure, as such pressure challenges a board’s ability to provide a credible commitment to stable managerial relationships, in turn jeopardizing efficient incentive design.
The above discussion has exposed the managerial power account of high executive pay as a reflection of inefficient rent extraction as both theoretically and empirically wanting, documenting empirical evidence that such pay is generally necessary to attract talented executives and increase firm value. It has further shown that protecting boards from short-term market and shareholder interference seems to lead to a more positive relationship between CEO pay and firm value. From a normative perspective, as we explain in this Part, these results carry crucial insights for the social welfare implications of the executive-compensation debate.
A. Rethinking “Entrenchment” Rents
Managerial power theory has been very influential in promoting the view that shareholder empowerment is the main solution to improve executive-compensation policies. In practice, this view has resulted in major executive-compensation reforms, including the introduction by the SEC of new rules on the disclosure of compensation policies, and most importantly, the provision of say-on-pay shareholder votes.[193] Yet, according to managerial power scholars, such reforms can at best help ameliorate the alleged inefficiencies of executive pay but not fully solve them. To this end, they argue, it is also necessary to make directors dependent on shareholders by changing the legal arrangements that insulate boards from market discipline.[194] Therefore, these scholars’ more ambitious reform agenda focuses on introducing new rules to eliminate the staggered board and other defensive measures, in addition to removing the procedural obstacles that favor incumbents’ access to the corporation’s proxy machinery.[195]
The theoretical and empirical analysis developed in this Article, however, implies that the above reform agenda is undesirable. Indeed, the managerial power scholars’ critique of entrenchment rents is grounded on reductionist assumptions about the transactional environment in which the relationships between boards, managers, and shareholders take place.[196] When examined against more realistic assumptions about the constraints arising from competitive market forces in a dynamic transactional context, allegedly inefficient entrenchment rents may help commit managers to long-term value creation, serving to offset both the distortions arising from increased talent competition and managerial incentives for inefficient intertemporal tradeoffs.[197] Therefore, measures designed to eliminate such rents should be regarded as counterproductive.
More concretely, the results of our event study in subpart IV(B) directly contradict the central policy recommendation of managerial power scholars that option grants should be preferred to restricted stock grants, using the argument that options are less costly to shareholders. This account of options overlooks the drawbacks that this form of compensation involves for long-term shareholder wealth. Indeed, the asymmetric payoffs of options may give managers incentives for taking risks that increase the likelihood that the stock price at the option’s exercise date will be higher than the option’s strike price, even if taking such risks may be detrimental to long-term firm value.[198] Conversely, the linear payoff of restricted stock helps mitigate short-termist incentives. Most important for the purpose of this discussion, our event study supports the view that the short-termist costs of options exceed their benefits, showing that the decreased use of option grants that followed the mandate to expense such pay components was associated with increased firm value.
Therefore, the position of managerial power scholars that compensating managers through restricted stock, rather than options, reflects the extraction of inefficient rents is invalid. Our results indicate that less skewed incentive plans better serve shareholder interests, as such plans help mitigate the distortions that may arise from excessive market and shareholder pressure for short-term value. The introduction of FAS123(R)—and the new trend it promoted towards the use of less option-based and more stock-based pay—should accordingly be regarded as helpful to improve executive-compensation practices.
B. Rethinking Board Authority vs. Shareholder Empowerment
More broadly, our analysis challenges the call of managerial power scholars for reforming corporate governance to eliminate a board’s defensive measures and empower shareholders. Contrary to what is argued by such scholars, the above discussion has shown that temporary board protection from short-term market discipline makes it more likely that the necessary conditions for a bilateral commitment toward long-term value creation by both shareholders and managers will be in place, in turn promoting efficient incentive design. In other words, when examined in the context of the informational asymmetry existing between firm insiders and outsiders and the consequential limited commitment problem of shareholders, the traditional board-centric model of the corporation emerges as economically rational. On the contrary, making directors more dependent on shareholders is likely to jeopardize the ability of that model to deliver efficient outcomes,[199] including value-increasing pay schemes.
We accordingly defend the traditional approach of the Delaware courts to executive-compensation matters as normatively desirable. Delaware’s approach has consistently accorded boards of directors a great deal of authority in setting executive pay by granting directors the protection of the business judgment rule.[200] This approach is thus consistent with the evidence provided in this Article that, in general, boards of directors efficiently design executive pay to attract the most talented executives, as well as the evidence that protecting boards from the interference of shareholders (including by means of shareholder litigation) helps promote a positive relationship between CEO pay and firm value.
Conversely, we challenge the current approach toward executive compensation of influential proxy advisory firms. These firms provide investors with voting recommendations on virtually any matter on which shareholders vote, including say-on-pay votes, playing today a major role in influencing corporate governance policies at many U.S. corporations.[201] While say-on-pay votes are nonbinding, low approval rates tend to bring about increased scrutiny of a firm’s corporate governance practices by activist shareholders, the media, and proxy advisory firms.[202] Importantly, this attention risks not just embarrassing directors, but fueling activist hedge fund campaigns, which may result in major disruptions to a company’s management.[203] Additionally, in a growing number of cases, negative shareholder votes on executive plans have triggered derivative shareholder lawsuits.[204]
In their recommendations, proxy advisory firms consider features that focus on the link between pay and performance and peer groups in benchmarking executive pay.[205] This is troubling for two reasons. First, the focus on shareholder returns may promote what has been called “earnings hysteria,”[206] inducing boards to adopt compensation that overemphasizes short-term performance. Consistent with this prediction, in a recent survey, companies reported making broad changes to executive-pay packages in response to advisory recommendations, with such changes affecting all areas of compensation programs and, in particular, compensation structures.[207] Second, peer-group benchmarking may also introduce distortions in executive pay, as under standard asymmetric information assumptions between firm insiders and outsiders, [208] the stock price might be temporarily off even in firms with talented management and good financial performance. Nevertheless, as put by one commentator, under the current influence exerted by proxy advisors on executive pay, temporary disappointing earnings may mean that “you fall below the peer group’s median return, fail ISS’s quantitative test and all of a sudden 30% of shareholders go against you.”[209]
It follows that policymakers and corporate actors would do well to reconsider the current case for enhanced shareholder power in corporate governance and the executive-pay process. Claiming that board protection from market discipline produces, among other drawbacks, inefficient CEO pay arrangements, managerial power scholars and other shareholder advocates have successfully advocated for a shift in corporate power from boards of directors to shareholders since the early 2000s. The introduction of say-on-pay votes is just one example of the several regulatory changes that have contributed to shareholder empowerment in the past fifteen years. Other significant changes have included, for example, modifications to proxy filing requirements that have facilitated the use of shareholder proposals[210] and amendments to the Delaware General Corporation Law that have granted shareholders greater access to the ballot box.[211] These regulatory reforms were also accompanied by changes in capital markets and corporate practices, including not just the rise of activist hedge funds[212] and proxy advisory firms,[213] but also the introduction of “universal” majority voting and accompanying withholding campaigns,[214] and the growing use and success of shareholder proposals.[215]
As a result of these developments, board power on corporate affairs, including the executive-pay process, has been significantly eroded. The decline in the use of staggered boards provides a vivid example of this erosion of board authority. While directors theoretically retain a veto power over destaggering decisions (as long as the board is established in the charter),[216] in recent years boards have increasingly acquiesced to destaggering proposals[217] under the pressure exerted by both proxy advisors[218] and activist shareholders.[219] Accordingly, the ability of boards to effectively use defensive measures to gain temporary protection from shareholder and market interferences is significantly diminished in the current corporate environment, potentially jeopardizing boards’ ability to design efficient pay schemes.
In response, we advocate measures that can restore the defensive value of staggered boards and other board protections, such as, for example, the requirement of supermajority requirements for dismantling such protections. As we explained in more detail in prior work, similar measures would help re-empower U.S. boards vis-à-vis shareholders and thereby help promote the stability that is necessary for long-term firm value creation.[220] Among other benefits, this institutional stability would help improve executive-compensation practices, which is in the long-term interest of shareholders and society as a whole. At the same time, to address concerns that board protection might become perpetual—and hence equally detrimental to efficient compensation design and shareholder interests—one of us has also explained elsewhere that board defenses should be designed to have a finite, predetermined life, with the option for shareholders to approve their extension for subsequent periods.[221]
While we are aware of the practical difficulties that the implementation of these proposals may encounter, it is noteworthy to observe that there have been recent signs that a demand for recalibrating corporate governance arrangements—including executive-pay schemes—toward the pursuing of long-term firm value seems to be emerging among the largest institutional investors.[222] Hopefully, the framework of analysis offered in this Article, and the conclusion it achieves, will prove useful to support this demand, while also providing policymakers with tangible reasons for reconsidering the current direction of corporate governance and executive-compensation policies.
“Managerial power theory”—the view that structural flaws in corporate governance, such as board defenses, enable managers to extract inefficient entrenchment rents—has risen to the forefront of the executive-compensation debate. The executive-compensation reforms that have taken place in recent years, such as the introduction of say-on-pay shareholder votes, provide perhaps the clearest evidence of this theory’s enormous influence. The common denominator of such reforms is their attempt to increase shareholder power vis-à-vis directors, consistent with the central claim of managerial power scholars that only by empowering shareholders can directors be made truly accountable and executive-compensation practices be improved.
In spite of having gained the upper hand, managerial power theory surprisingly lacks robust empirical testing. Equally surprising is the failure of managerial power scholars to thoroughly confront the currently prevailing economic paradigm of executive compensation: “managerial talent theory,” according to which high executive pay reflects compensation for scarce managerial talent in competitive markets.
This Article remedies these failures, reviewing the main arguments of managerial power theory both theoretically and empirically and finding them wanting. Supporting the managerial talent view of executive pay, we conclude that high executive pay is generally consistent with optimal board contracting towards the attraction and retention of scarce, talented managers, rather than with opportunistic rent extraction by managers.
Our study shows that once one incorporates competitive market forces and the dynamic nature of managerial employment relationships into the analysis, granting managers high rents emerges as beneficial, rather than detrimental, to shareholder interests. Indeed, paying managers these rents helps ensure that a manager’s continuation payoff (that is, the expectation of future compensation) can be “exploited” as a bonding mechanism to commit the manager to the creation of long-term firm value. There are two reasons. First, the expectation of high future rents helps offset the potential distortions that a manager’s chances at mobility may introduce in managerial incentive schemes within a competitive environment. Second, expected high rents mitigate the short-termist incentives that managers may develop in the context of dynamic employment relationships, as the prospect of losing these rents disincentivizes managers to undertake strategies that boost short-term performance at the expense of future losses.
Within this analytical framework, we show that board protection from market discipline, whether in the form of intense product-market competition or greater shareholder power, is likely to increase, rather than decrease, the efficiency of executive-compensation plans. Board protection does so by reducing the risk that market discipline will interfere with a manager’s continuation value, thereby making shareholders’ own commitment to long-term value creation credible and avoiding value-decreasing, short-termist distortions in executive-pay schemes. The evidence we provide on the overuse of option grants in the past decade offers a vivid illustration of such distortions, as this evidence suggests that boards that are more exposed to market forces are more likely to use option-based compensation that emphasizes short-term performance at the expense of long-term firm value.
Going forward, policymakers would do well to reconsider the case for enhanced shareholder power in corporate governance, which has driven recent executive-compensation reforms and which has boosted the influence of proxy advisory firms on the executive-pay process. As this Article has shown, this case is theoretically lacking, unsupported by the data, and seems detrimental to both the interests of shareholders and society as a whole.
Future research would also do well to reexamine proposals to reform executive pay in the attempt to address the rising income inequality in the United States.[223] Our analysis suggests that blaming boards of directors and managers for this rising inequality[224] reflects a fundamentally reductionist understanding of the dynamics that have led to the rise in CEO pay. Accordingly, proposals that penalize firms for high executive pay will perhaps placate the populist indignation over CEO compensation, but are unlikely to effectively address related inequality issues.
Rather than pursuing such proposals, it would be desirable to focus on exploring the many questions that still remain unanswered about the link between executive pay and labor income inequality. In particular, under this Article’s analysis, the neoclassical question resurfaces of whether the increased demand for a super-skilled workforce might at least in part explain the widening labor income gap. Similarly, the question arises of whether a link exists between labor income inequality and sets of social norms other than those allegedly favoring managerial opportunism. Beginning to answer these questions will hopefully produce reform interventions that can effectively tackle inequality, rather than just feed populism.
Definitions of CEO Compensation Variables
Appendix Table A presents brief definitions of the CEO compensation variables that appear in the analysis. All variables are winsorized at one percent in both tails.
| CEO Compensation Variables: | ||
| CEO Pay | Natural logarithm of total CEO compensation in that fiscal year, using the measure ‘TDC1’ in ExecuComp, which defines CEO Pay as the sum of salary, bonus, stock grants, the Black-Scholes value of new option grants, plus any other deferred compensation, including pension benefits. | |
| Equity Portion | The percentage of total CEO compensation (measured by ‘TDC1’ in ExecuComp) that is awarded to the CEO in the fiscal year that comes in the form of stock grants (‘rstkgrant’ in ExecuComp until 2006, ‘stock_awards_fv’ in ExecuComp after 2006) or option grants (‘option_awards_blk_value’ in ExecuComp until 2006, ‘option_awards_fv’ in ExecuComp after 2006). | |
| Stock Portion | The percentage of total CEO compensation (measured by ‘TDC1’ in ExecuComp) that is awarded to the CEO in the fiscal year that comes in the form of stock grants (‘rstkgrant’ in ExecuComp until 2006, ‘stock_awards_fv’ in ExecuComp after 2006). | |
| Option Portion | The percentage of total CEO compensation (measured by ‘TDC1’ in ExecuComp) that is awarded to the CEO in the fiscal year that comes in the form of option grants (‘option_awards_blk_value’ in ExecuComp until 2006, ‘option_awards_fv’ in ExecuComp after 2006). | |
| PPS (Pay Performance Sensitivity) | Natural logarithm of (1 + Delta), where Delta measures how much the dollar value (in thousands of US$) of the CEO’s stock and options held changes if the firm’s stock price increases by 1%. Data comes from the website of Lalitha Naveen and was derived from ExecuComp data, and is updated from the data as previously used in Coles, Daniel and Naveen (2006). | |
| PVS (Pay Volatility Sensitivity) | Natural logarithm of (1 + Vega), where Vega measures how much the dollar value (in thousands of US$) of the CEO’s options held changes if the annualized volatility of the firm’s stock returns increases by 1%. Data comes from the website of Lalitha Naveen and was derived from ExecuComp data, and is updated from the data as previously used in Coles, Daniel and Naveen (2006). | |
Definitions of Other Variables
Appendix Table B presents brief definitions of the main variables that appear in the analysis other than the CEO compensation variables described in Appendix Table A. All continuous variables are winsorized at one percent in both tails.
| Variables: | ||
| Q | Tobin’s Q, defined as the Market value of assets (i.e., Total Assets – Book Equity + Market Equity) divided by the book value of assets. Calculation follows Fama and French (1992). Source of data is Compustat annual data file. | |
| Staggered Board | Indicator variable equal to one (zero otherwise) if the board is staggered. Data is obtained from RiskMetrics, SharkRepellent.net and hand collection for 1990-2015. | |
| Poison Pill | Indicator variable equal to one (zero otherwise) if the firm has a poison pill. Data is obtained from from RiskMetrics, SharkRepellent.net and hand collection for 1990-2015. | |
| Institutional Ownership | The percentage of outstanding shares held by institutional owners. Data is from CRSP (number of outstanding shares) and Thomson Reuters (institutional ownership from 13F filings). | |
| Post 2010 | Indicator variable equal to one if the fiscal year is after 2010, and equal to zero otherwise. | |
| Assets | Logarithm of the book value of total assets from Compustat. | |
| Stock Return Volatility | Standard deviation of the daily stock return, from CRSP. | |
| Leverage | Ratio of the book value of total debt to the book value of total assets, from Computat. | |
| Delaware Incorporation | Indicator variable if the company is incorporated in Delaware, from historical CRSP header files. | |
| Profitability | Accounting profitability, measured as the ratio of the book value of earnings before interest, taxes, depreciation and amortization (EBITDA) over the book value of total assets, from Compustat. | |
| CAPX/Assets | Ratio of the book value of capital expenditures over the book value of total assets, from Compustat. | |
| R&D/Sales | Ratio of the book value of R&D over the book value of total sales, from Compustat. | |
| Product Competition | Negative of the Herfindahl index, which is a measure of industry concentration of the sales in the industry across all publicly traded firms in the industry, such that more industry concentration means a higher Herfindahl index and thus a lower level of Product Market Competition. Source of data is Compustat annual data file. | |
| M&A Competition | The ratio of mergers & acquisitions’ dollar volume in SDC to the total market capitalization from CRSP for a calendar year, per industry. The CRSP annual industry market capitalization is for ordinary stocks only and excludes ADRs and REITs. If no M&A activity per given industry-year is reported in SDC, we assume it to be zero. We only include transactions in SDC where the buyer achieves control of the target. | |
| Talent Competition | Natural logarithm of the market capitalization of the outstanding shares of the 250th ranked firm in terms of market capitalization, from CRSP. | |
| Market Cap | Natural logarithm of the market capitalization of the outstanding shares of the firm, from CRSP. | |
Descriptive Statistics
Appendix Table C presents sample descriptive statistics for the main variables. The sample consists of all ExecuComp firms without dual class stock in non-regulated industries.
| Variable | Mean | Median | St. Dev. | Min | Max | Obs. | |
| CEO Pay | 8.048 | 8.066 | 0.998 | 6.001 | 10.036 | 19,572 | |
| Equity Portion | 0.442 | 0.482 | 0.277 | 0.000 | 1.000 | 19,572 | |
| Stock Portion | 0.164 | 0.000 | 0.228 | 0.000 | 1.000 | 19,572 | |
| Option Portion | 0.277 | 0.231 | 0.269 | 0.000 | 1.000 | 19,572 | |
| PPS (Pay Performance Sensitivity) | 5.519 | 5.499 | 1.418 | 2.302 | 8.655 | 18,653 | |
| PVS (Pay Volatility Sensitivity) | 3.862 | 4.092 | 1.740 | 0.000 | 6.796 | 19,119 | |
| Tobin’s Q | 1.890 | 1.524 | 1.186 | 0.482 | 11.714 | 19,572 | |
| Classified Board | 0.565 | 1.000 | 0.496 | 0.000 | 1.000 | 19,572 | |
| Poison Pill | 0.469 | 0.000 | 0.499 | 0.000 | 1.000 | 19,572 | |
| Institutional Ownership | 0.717 | 0.745 | 0.178 | 0.001 | 0.999 | 17,984 | |
| Assets | 7.612 | 7.444 | 1.561 | 3.862 | 12.444 | 19,572 | |
| Stock Return Volatility | 0.026 | 0.023 | 0.012 | 0.009 | 0.063 | 19,349 | |
| Leverage | 0.480 | 0.478 | 0.212 | 0.118 | 0.958 | 19,514 | |
| Delaware Incorporation | 0.629 | 1.000 | 0.483 | 0.000 | 1.000 | 19,572 | |
| Profitability | 0.142 | 0.138 | 0.092 | -0.402 | 0.472 | 19,572 | |
| CAPX/Assets | 0.053 | 0.038 | 0.051 | 0.000 | 0.344 | 19,572 | |
| R&D/Sales | 0.044 | 0.001 | 0.114 | 0.000 | 3.338 | 19,572 | |
| Product Competition | 0.075 | 0.059 | 0.055 | 0.018 | 0.310 | 19,572 | |
| M&A Competition | 0.027 | 0.009 | 0.070 | 0.000 | 1.175 | 19,572 | |
| Talent Competition | 9.653 | 9.788 | 0.417 | 8.378 | 10.289 | 19,572 | |
| Market Cap | 7.636 | 7.518 | 1.594 | 0.980 | 13.348 | 19,572 | |
- .Krista Hughes & Toni Clarke, Trump Says High Pay for CEOs is a Joke and ‘Disgraceful’, Reuters (Sept. 13, 2015), http://www.reuters.com/article/us-usa-election-trump-idUSKCN0RD0PA20150913 [https://perma.cc/8JCM-YTVQ]. ↑
- .Dan Merica & Eric Bradner, Clinton Focuses on Economy Amid Email Controversy, CNN (July 24, 2015), http://www.cnn.com/2015/07/24/politics/hillary-clinton-economic-speech-2016-new-york [https://perma.cc/Y64Z-94EZ]. ↑
- .Kevin J. Murphy, Executive Compensation: Where We Are, and How We Got There, in 2A Handbook of the Economics of Finance 211, 213 (George M. Constantinides et al. eds., 2013). ↑
- .See sources cited infra note 48. ↑
- .See Jean-Jacques Laffont & David Martimort, The Theory of Incentives: The Principal-Agent Model 145 (2002) (“By the mere fact of delegation, the principal often loses any ability to control those actions [of the agent] that are no longer observable. . . . Those actions cannot be contracted upon because no one can verify their value. In such cases we will say that there is moral hazard.”). ↑
- .See Lucian A. Bebchuk, The Myth of the Shareholder Franchise, 93 Va. L. Rev. 675, 679–80 (2007) (describing the classic view that the board is charged with addressing the vertical agency problem between shareholders and managers). ↑
- .Lucian Bebchuk & Jesse Fried, Pay Without Performance: The Unfulfilled Promise of Executive Compensation 23–44, 55–56 (2004). ↑
- .See id. at 62 (using the term “rents” to refer “to the additional value that managers obtain beyond what they would get in arm’s-length bargaining with a board that had both the inclination to maximize shareholder value and the necessary time and information to perform that task properly”). ↑
- .See, e.g., William W. Bratton, The Academic Tournament over Executive Compensation, 93 Calif. L. Rev. 1557, 1560 (2005) (reviewing Bebchuk & Fried, supra note 7) (explaining that Bebchuk and Fried’s managerial power theory “change[d] the terms of discourse” in the field); Randall S. Thomas & Harwell Wells, Executive Compensation in the Courts: Board Capture, Optimal Contracting, and Officers’ Fiduciary Duties, 95 Minn. L. Rev. 846, 847–48, 852 (2011) (observing that “Board Capture” theory, or managerial power theory, is “[f]ar more popular” than “the belief that the American executive compensation system works well”). ↑
- .See infra notes 86–88 and accompanying text. ↑
- .See Dodd-Frank Wall Street Reform and Consumer Protection Act, Pub. L. No. 111-203, § 951(a)(1), 124 Stat. 1376, 1899 (2010) (codified as amended at 15 U.S.C. § 78n-1). ↑
- .See infra note 74 and accompanying text. ↑
- .See Bengt Holmström, Pay Without Performance and the Managerial Power Hypothesis: A Comment, 30 J. Corp. L. 703, 708 (2005) (generally observing that managerial power theory is premised on “the traditional moral hazard model,” which is a static model); Lucian A. Bebchuk & Holger Spamann, Regulating Bankers’ Pay, 98 Geo. L.J. 247, 249 (2010) (explicitly employing a one-period model of executive compensation). ↑
- .See, e.g., Alex Edmans & Xavier Gabaix, Executive Compensation: A Modern Primer, 54 J. Econ. Literature 1232, 1260 (2016) (analyzing “dynamic models of moral hazard”). ↑
- .In a staggered board, directors are grouped into different classes (usually three), and each class of directors stands for reelection in successive years, which requires challengers to win at least two election cycles to gain a board majority. See Richard H. Koppes et al., Corporate Governance Out of Focus: The Debate over Classified Boards, 54 Bus. Law. 1023, 1029 n.19 (1999) (providing a list of relevant state law provisions allowing staggered boards). ↑
- .See K.J. Martijn Cremers & Simone M. Sepe, The Shareholder Value of Empowered Boards, 68 Stan. L. Rev. 67, 73–74, 114–15 (2016) (documenting evidence that staggered boards positively affect firm value); K.J. Martijn Cremers, Lubomir Litov & Simone M. Sepe, Staggered Boards and Long-Term Firm Value, Revisited, J. Fin. Econ. (forthcoming 2017) (manuscript at 2–3), https://papers.ssrn.com/sol3/papers.cfm?abstract_id=2364165 [https://perma.cc/758K-8MZW] (providing robust evidence that staggered boards are not negatively related to firm value). ↑
- .One of us explored the positive and normative implications of a dynamic approach to executive compensation in earlier work. See Simone M. Sepe, Making Sense of Executive Compensation, 36 Del. J. Corp. L. 189, 212–13 (2011). As a positive matter, the analysis developed in this Article expands this earlier analysis, incorporating a competitive-market framework. As a normative matter, it revisits that analysis, based on the novel empirical evidence produced herein. ↑
- .This Article uses the terms “short-termism” and “managerial myopia” interchangeably to refer to an excessive managerial focus on short-term results at the expense of long-term firm value. The standard reference for myopia studies is the pioneering work of Jeremy Stein. See Jeremy C. Stein, Efficient Capital Markets, Inefficient Firms: A Model of Myopic Corporate Behavior, 104 Q.J. Econ. 655, 667 (1989) (explaining that “myopia can arise from one of three ‘imperfections’: (1) invisibility of some managerial action, (2) ex ante superior information on the part of managers, or (3) inefficiencies in stock prices”); Jeremy C. Stein, Takeover Threats and Managerial Myopia, 96 J. Pol. Econ. 61, 63–66 (1988) (modeling a scenario in which managers engage in “wasteful signaling” in order to boost current earnings). ↑
- .The assumption here is that the manager is not terminated in earlier periods for poor performance. Put differently, for the continuation value mechanism to be viable, some level of tolerance for what may appear as “early failure” is required. See Gustavo Manso, Motivating Innovation, 66 J. Fin. 1823, 1823–24 (2011) (arguing that pay-for-performance schemes that reward or penalize managers based on near-term outcomes may have adverse consequences if the goal is to induce managers to explore new, untested investments). ↑
- .Similar to when they are exposed to enhanced shareholder power, managers are subject to intense market-driven discipline in environments with intense product competition due to relative performance evaluations under which the imperative for managers is beating competitors. See Jean Tirole, The Theory of Corporate Finance 20, 28–29 (2006). ↑
- .See infra text accompanying notes 63–64. ↑
- .See infra text accompanying notes 65–69. ↑
- .See infra subpart III(A). ↑
- .As it has become standard in the empirical literature, we employ Tobin’s Q as a proxy for firm value. See, e.g., Lucian A. Bebchuk & Alma Cohen, The Costs of Entrenched Boards, 78 J. Fin. Econ. 409, 419 (2005) (listing other studies that employ Tobin’s Q). Tobin’s Q is the ratio of the market value of assets to the book value of assets. Eugene F. Fama & Kenneth R. French, Testing Trade-Off and Pecking Order Predictions About Dividends and Debt, 15 Rev. Fin. Stud. 1, 8 (2002). ↑
- .See Jeffrey M. Wooldridge, Econometric Analysis of Cross Section and Panel Data 50–51 (2002). ↑
- .See infra notes 144–47 and accompanying text. ↑
- .See infra notes 210–14 and accompanying text. ↑
- .Adolf A. Berle, Jr. & Gardiner C. Means, The Modern Corporation and Private Property 7, 84–89 (William S. Hein & Co. reprt. ed. 1982) (1933). ↑
- .Michael C. Jensen & William H. Meckling, Theory of the Firm: Managerial Behavior, Agency Costs and Ownership Structure, 3 J. Fin. Econ. 305, 305–08 (1976). ↑
- .For surveys of the vast literature on optimal contracting theory, see, for example, Kevin J. Murphy, Executive Compensation, in 3B Handbook of Labor Economics 2485, 2519–22 (Orley C. Ashenfelter & David Card eds., 1999) (discussing classical contributions) and Alex Edmans & Xavier Gabaix, Is CEO Pay Really Inefficient? A Survey of New Optimal Contracting Theories, 15 Eur. Fin. Mgmt. 486, 488–93 (2009) (discussing more recent contributions). ↑
- .John E. Core et al., Is U.S. CEO Compensation Inefficient Pay Without Performance?, 103 Mich. L. Rev. 1142, 1145–46 (2005) (reviewing Lucian Bebchuk & Jesse Fried, Pay Without Performance: The Unfulfilled Promise of Executive Compensation (2004)). ↑
- .Eugene F. Fama & Michael C. Jensen, Separation of Ownership and Control, 26 J.L. & Econ. 301, 308–10 (1983). ↑
- .See Brehm v. Eisner, 746 A.2d 244, 263 (Del. 2000) (“[A] board’s decision on executive compensation is entitled to great deference. It is the essence of business judgment for a board to determine if a particular individual warrant[s] large amounts of money . . . .”). The sole exception is given by the doctrine of waste, under which judicial intervention in matters of executive compensation is warranted if “no person of ordinary, sound business judgment would deem it worth what the corporation has paid.” Saxe v. Brady, 184 A.2d 602, 610 (Del. Ch. 1962). Since the 1990s, however, applications of the waste doctrine have become increasingly rare, so much that Leo E. Strine Jr., now chief justice of the Delaware Supreme Court, described waste as a “vestige” of discarded doctrines. Harbor Fin. Partners v. Huizenga, 751 A.2d 879, 897 (Del. Ch. 1999). ↑
- .Michael C. Jensen & Kevin J. Murphy, Performance Pay and Top-Management Incentives, 98 J. Pol. Econ. 225, 226 (1990). ↑
- .See John Roberts, The Modern Firm 127 (2004) (“For simplicity we call the action being taken [by the agent] ‘effort provision,’ but numerous other interpretations are possible.”). ↑
- .See Jensen & Meckling, supra note 29, at 308 (describing the costs associated with ensuring that the agent’s actions align with the principal’s viewpoint and interests). ↑
- .See Laffont & Martimort, supra note 5, at 29 (referring to agency rent as “information rent”). ↑
- .See Bernard Salanié, The Economics of Contracts: A Primer 122 (2d ed. 2005) (noting the importance of taking into account the manager’s “outside option”). ↑
- .The standard reference is to Michael C. Jensen & Kevin J. Murphy, CEO Incentives—It’s Not How Much You Pay, but How, Harv. Bus. Rev., May–June 1990, at 138, 143. ↑
- .In the absence of more immediate proxies for evaluating corporate results, stock market value is described as the most reliable indicator of the “value of the entire future stream of expected cash flows.” Michael C. Jensen, A Theory of the Firm: Governance, Residual Claims, and Organizational Forms 146 (2000). Total compensation is generally comprised of six basic components: (1) base salaries; (2) discretionary bonuses; (3) non-equity incentives (based on both annual and multi-year performance measures); (4) stock options; (5) stock awards; and (6) other pay. Murphy, supra note 3, at 221. The “other pay” component usually includes items such as severance/change in control benefits, perquisites, pensions, post-retirement and consulting contracts. ↑
- .By posing that the Manager’s outside option is $5, we are assuming here an environment with virtually no competition. The modification of our example in section (I)(C)(2) below relaxes this assumption. ↑
- .See Bengt Holmström, Moral Hazard and Observability, 10 Bell J. Econ. 74, 75–76 (1979) (modeling the principal’s monetary payoff as a function of both the agent’s unobservable actions, i.e., effort, and a random state of nature, with the expected realization of the principal’s monetary payoff increasing in the agent’s effort level). Of course, here we are assuming that corporate risk is unaffected by systemic changes; that is, we are only considering the idiosyncratic risk that cannot be diversified away. ↑
- .Laffont & Martimort, supra note 5, at 145–46. ↑
- .For simplicity, we assume here that no agency costs arise between the Board and the shareholders. Of course, as we explain in section (I)(B)(1) below, admitting or rejecting this assumption is at the center of the controversy between optimal contracting scholars and managerial power scholars. ↑
- .Private-benefit extraction also reduces aggregate welfare, as (0.8) ($1,000) > (0.6) ($1,000) + $4. ↑
- .Under the assumption that the Manager’s reservation utility is $5 as above, this compensation plan also automatically satisfies the Manager’s participation constraint. ↑
- .Note that while $20 is the actual agency rent the Manager will receive in case of success, $16 is the expected cost of the agency rent to the corporation (that is, the shareholders). ↑
- .See generally Bebchuk & Fried, supra note 7; Lucian Arye Bebchuk & Jesse M. Fried, Executive Compensation as an Agency Problem, J. Econ. Persp., Summer 2003, at 71 [hereinafter Bebchuk & Fried, Executive Compensation]; Lucian Arye Bebchuk, Jesse M. Fried & David I. Walker, Managerial Power and Rent Extraction in the Design of Executive Compensation, 69 U. Chi. L. Rev. 751 (2002) [hereinafter Bebchuk et al., Managerial Power]. For an anticipation of the managerial power view in legal literature, see Charles M. Elson, Director Compensation and the Management-Captured Board—The History of a Symptom and a Cure, 50 SMU L. Rev. 127 (1996). Similarly, for earlier economic work on managerial power theory, see generally Marianne Bertrand & Sendhil Mullainathan, Are CEOs Rewarded for Luck? The Ones Without Principals Are, 116 Q.J. Econ. 901 (2001). ↑
- .See Bebchuk & Fried, supra note 7, at 4, 5, 23 (pointing to time and information constraints as well as financial, psychological, and social factors as undermining directors’ ability to negotiate compensation arrangements with managers that are in the shareholders’ interest). ↑
- .Bebchuk & Fried, Executive Compensation, supra note 48, at 72–73. ↑
- .See Bebchuk & Fried, supra note 7, at 53–58 (discussing the degree to which market forces bear upon CEO compensation arrangements). ↑
- .Id. at 58. ↑
- .Id. at 45–48. ↑
- .Bebchuk & Fried, supra note 7, at 207. Bebchuk and Fried hint at these problems in the policy part of their book. See id. at 201–16 (“[T]he safety valve of potential ouster via the ballot box—on which our corporate governance system is supposed to rely—has been all but shut off.”). However, in the past decade, it has been Lucian Bebchuk that has emerged as the leading voice among so-called shareholder advocates. These advocates defend a model with stronger shareholder rights as the necessary response to the managerial entrenchment problem. See Lucian Arye Bebchuk, The Case for Increasing Shareholder Power, 118 Harv. L. Rev. 833, 851–75 (2005) (advocating for the expansion of shareholder governance rights); Lucian A. Bebchuk, The Myth of the Shareholder Franchise, 93 Va. L. Rev. 675, 694–711 (2007) [hereinafter Bebchuk, Shareholder Franchise] (advocating for a reform of corporate elections to make directors more accountable to shareholders). ↑
- .See Lucian Bebchuk et al., What Matters in Corporate Governance?, 22 Rev. Fin. Stud. 783, 788 (2009). In this article, the authors developed an entrenchment index (or “E index”) based on six measures of board protection, including staggered boards and poison pills, and claim that the empirical evidence supports the view that such measures are value reducing. See id. at 786. But see K.J. Martijn Cremers, Saura Masconale & Simone M. Sepe, Commitment and Entrenchment in Corporate Governance, 110 Nw. U. L. Rev. 727, 732, 761–71 (2016) (revisiting the evidence obtained on the E-Index and showing that defensive measures benefit shareholders as long as such measures provide for shareholder approval). ↑
- .A poison pill consists of stock purchase rights that are granted to existing shareholders in the event a corporate raider accumulates more than a certain threshold of outstanding stock and that entitle the existing shareholders (but not the raider) to acquire newly issued stock at a substantial discount from the market price. See Memorandum from Wachtell, Lipton, Rosen & Katz, Share Purchase Rights Plan (Mar. 1994), in Robert B. Thompson, Mergers and Acquisitions: Law and Finance 204 (2010) (setting forth the terms of a standard poison pill). ↑
- .Lucian Arye Bebchuk et al., The Powerful Antitakeover Force of Staggered Boards: Theory, Evidence, and Policy, 54 Stan. L. Rev. 887, 893, 899, 902 (2002). Bebchuk et al. employed an event study to examine the wealth effects of staggered boards, finding that staggered boards have a negative effect on shareholder returns. See id. at 891. But see Cremers & Sepe, supra note 16, at 90–91 (arguing that the results of Bebchuk et al. are endogenous). ↑
- .See Bebchuk, Shareholder Franchise, supra note 54, at 688–94 (detailing these procedural costs). ↑
- .See Bebchuk & Fried, supra note 7, at 27–39, 80–86 (describing the various sources of executives’ power to influence directors). A variation on the account of directors as captured by managers is the one considering directors’ “structural bias.” As put by Claire Hill and Brett McDonnell, “[t]he term ‘structural bias’ is used in corporate law cases to refer to excessive deference by the directors to the management because of interlocking relationships or because they travel in the same social and economic circles.” Claire Hill & Brett McDonnell, Executive Compensation and the Optimal Penumbra of Delaware Law, 4 Va. Bus. L. Rev. 333, 335 n.2 (2009). This variation, however, does not affect this Article’s analysis of managerial power theory. ↑
- .Id. ↑
- .Bebchuk & Fried, Executive Compensation, supra note 48, at 88. ↑
- .Bebchuk & Fried, supra note 7, at 183–85. ↑
- .See id. at 62. As we explain below, under the realistic assumption of a competitive setting, an executive’s agency (or total) rents include both what we refer to as “pure” agency rents and market rents. See infra section I(C)(2). ↑
- .Id. at 121–36. This is not to say that any non-equity component of a manager’s pay package should be regarded as an entrenchment rent. In general, optimal pay packages need to include both some fixed components and some equity components. See Sepe, supra note 17, at 217–19 (showing that equity components are desirable to promote effort, while fixed components help constrain excessive risk-taking). For managerial power scholars, however, fixed compensation is inherently less likely to promote effort and, hence, more likely to pay the manager entrenchment rents that are not tied to performance. Bebchuk & Fried, supra note 7, at 63. ↑
- .See Bebchuk & Fried, supra note 7, at 170–73 (“The increased use of restricted stock is generally viewed as a response to shareholder concern about conventional options . . . . [But] firms replacing conventional options with restricted stock are ending up with an equity-based incentive plan that contains an even larger windfall element.”). ↑
- .See id. at 190 (arguing that with opportune “filtering, the same amount of incentives [that is provided, for example, through restricted stock] can be provided at a lower cost, or more incentives can be provided at the same cost”). ↑
- .Recall that $1.12 is the expected share value when the Manager exerts effort. ↑
- .In agency models, when the incentive constraint is “binding” (that is, the values are the same), it is standard to assume that an agent will behave. See Tirole, supra note 20, at 116–17. ↑
- .See supra note 63 (dissecting the meaning of “entrenchment rents”). ↑
- .Cf. Edmans & Gabaix, supra note 14, at 1233 (using the term “shareholder value” theory). ↑
- .See Xavier Gabaix & Augustin Landier, Why Has CEO Pay Increased So Much?, 123 Q.J. Econ. 49, 50 (2008) (building an equilibrium model in which the marginal product of managerial ability increases with firm size); Kevin J. Murphy & Ján Zábojník, CEO Pay and Appointments: A Market-Based Explanation for Recent Trends, Am. Econ. Rev., May 2004, at 192, 192–93 (developing a general equilibrium model that explains the increase in executive pay as a result of the increased prevalence of general, transferrable executive skills). ↑
- .See Murphy, supra note 3, at 214 (using the term “efficient contracting” theory to define a view of executive compensation that blends optimal contracting with managerial talent theory). ↑
- .See Edmans & Gabaix, supra note 14, at 1233 (detailing the flaws in the models of bilateral contracting as applied to CEO-employment relationships). ↑
- .Id. ↑
- .It is worth emphasizing that agency rents are driven by the Manager’s incentive constraint, while market rents are driven by competitive forces that impact the Manager’s participation constraint. ↑
- .See supra text accompanying note 47. ↑
- .Note that the form this market rent takes (e.g., salary, bonus, or contingent compensation) is indifferent as long as the Manager expects to receive additional compensation for $24. ↑
- .For example, assume that with a less talented manager, Manager II, Corporation I’s project would generate revenues of $1,000 with probability 70% and zero revenues with probability 30%. Like Manager I, Manager II can also extract a private benefit of $4, in which case the probability of the project’s success drops to 50%. Under the assumption that Board I will offer Manager II the equilibrium agency rent of $20, Manager II will then avoid private-benefit extraction, but deliver a lower outcome than Manager I as she is less talented: (0.7) ($1,000) instead of (0.8) ($1,000). Consequently, if Board I refused to pay Manager I the market rent of $24, this would result in an expected revenue loss of $100 for the shareholders, which makes the payment of the market rent the only rational choice for Board I. ↑
- .See John E. Core, Wayne R. Guay & David F. Larcker, Executive Equity Compensation and Incentives: A Survey, Fed. Res. Bank N.Y. Econ. Pol’y Rev., Apr. 2003, at 27, 27–28 (focusing, in particular, on the literature on equity-based compensation). ↑
- .See generally Carola Frydman & Dirk Jenter, CEO Compensation, 2 Ann. Rev. Fin. Econ. 75 (2010). ↑
- .See Core, Guay & Larcker, supra note 79, at 34–35, 44 (discussing the mixed evidence on executive compensation and performance); Frydman & Jenter, supra note 80, at 76 (noting the inconsistencies between executive-compensation theories and the existing empirical evidence). ↑
- .See Benjamin E. Hermalin, Trends in Corporate Governance, 60 J. Fin. 2351, 2351, 2376 (2005) (analyzing the potential consequences of a possible trend towards “more diligent boards of directors”); Bengt Holmström & Steven N. Kaplan, The State of U.S. Corporate Governance: What’s Right and What’s Wrong?, J. Applied Corp. Fin., Spring 2003, at 8, 15 (commenting favorably on certain improvements made to board governance while cautioning that further improvements remain to be made). ↑
- .See Jeffrey N. Gordon, The Rise of Independent Directors in the United States, 1950-2005: Of Shareholder Value and Stock Market Prices, 59 Stan. L. Rev. 1465, 1473–76 (2007) (discussing the changes in board compositions, specifically the percentage of inside directors, over the past several decades). ↑
- .Mark R. Huson et al., Internal Monitoring Mechanisms and CEO Turnover: A Long-Term Perspective, 56 J. Fin. 2265, 2266 (2001). ↑
- .See K.J. Martijn Cremers & Yaniv Grinstein, Does the Market for CEO Talent Explain Controversial CEO Pay Practices?, 18 Rev. Fin. 921, 923–24 (2014) (examining the role of labor-market competition in compensation patterns for CEOs); Kevin J. Murphy & Ján Zábojník, Managerial Capital and the Market for CEOs 31 (Apr. 2007) (unpublished manuscript), https://papers.ssrn.com/sol3/papers.cfm?abstract_id=984376 [https://perma.cc/BNW8-L6XH]:In our theory, the level of CEO pay is determined by competition among firms for top performing managers, and depends upon the portion of the CEOs’ skills that is transferable across firms and industries. We suggest that the increase in executive compensation can be explained by an increase in the importance of general managerial skills, as opposed to firm-specific knowledge, in managing the modern corporation. ↑
- .Executive Compensation and Related Person Disclosure, Exchange Act Release Nos. 33–8732A, 34–54302A, IC–27444A, 71 Fed. Reg. 53,158, 53,165 (Sept. 8, 2006), https://www.
gpo.gov/fdsys/pkg/FR-2006-09-08/pdf/06-6968.pdf [https://perma.cc/7Z3B-PJEJ]. ↑ - .See id. at 53,176. ↑
- .Dodd-Frank Wall Street Reform and Consumer Protection Act, Pub. L. No. 111-203, § 951(a)(1), 124 Stat. 1376, 1899 (2010) (codified as amended at 15 U.S.C. § 78n-1). ↑
- .See supra note 53. ↑
- .See supra note 55 and accompanying text. ↑
- .Cremers, Masconale & Sepe, supra note 55, at 749–51. ↑
- .Cremers, Litov & Sepe, supra note 16 (manuscript at 2–3, 16). ↑
- .See Bebchuk & Fried, supra note 7, at 88–89 (asserting that managers’ influence over the board contributes to a disinclination to terminate managers and to “the practice of gratuitous goodbye payments” in cases where a manager is fired). ↑
- .See generally Holmström, supra note 13. ↑
- .Id. at 708. ↑
- .The average tenure of U.S. CEOs is around seven years. See Steven N. Kaplan & Bernadette A. Minton, How Has CEO Turnover Changed?, 12 Int’l Rev. Fin. 57, 58 (2012) (studying the period from 1992 to 2007). ↑
- .Holmström, supra note 13, at 713. ↑
- .See Bebchuk & Spamann, supra note 13, at 256 (assuming only present and future periods for the sake of simplicity because “[w]ith multiple periods, the analysis would become more complex, but our general conclusions would not change”). ↑
- .See Edmans & Gabaix, supra note 14, at 1234, 1260 (explaining that a dynamic multi-period model adds certain challenges but also provides advantages unavailable in a single-period model). ↑
- .See supra section I(C)(2). ↑
- .The realization of positive interim payoffs provides “hard” information that is easily incorporated into the stock price and that, therefore, investors can easily verify. See Tirole, supra note 20, at 249–50 (observing that “hard” information, which “can be verified by the investors once disclosed by the issuer,” reduces asymmetry of information between issuers and investors). ↑
- .See supra section I(C)(2). ↑
- .See supra note 18. ↑
- .See supra notes 39–40 and accompanying text. ↑
- .A dynamic setting necessarily modifies the assumption made above about no managerial discounting. See supra section I(B)(2). ↑
- .See Simone M. Sepe, Regulating Risk and Governance in Banks: A Contractarian Perspective, 62 Emory L.J. 327, 338–46 (2012) (discussing risk-taking incentives in the banking sector). ↑
- .Simone M. Sepe & Charles K. Whitehead, Paying for Risk: Bankers, Compensation, and Competition, 100 Cornell L. Rev. 655, 659–60, 668–74 (2015). ↑
- .See supra section I(B)(2). ↑
- .See supra note 19. ↑
- .See Sepe, supra note 17, at 219–23 (providing a formal model that explores the incentive function of fixed-compensation contracts in a dynamic setting). ↑
- .See supra text accompanying notes 65–69. ↑
- .See supra text accompanying note 69. ↑
- .See supra text accompanying note 47. ↑
- .For an economic account of the distorted risk-incentives that managers compensated with equity-based pay may develop, see, for example, Patrick Bolton et al., Executive Compensation and Short-Termist Behaviour in Speculative Markets, 73 Rev. Econ. Stud. 577, 577–78 (2006) and Ing-Haw Cheng et al., Yesterday’s Heroes: Compensation and Creative Risk-Taking 2 (Nat’l Bureau of Econ. Research, Working Paper No. 16176, 2010), http://www.
nber.org/papers/w16176.pdf [https://perma.cc/Y4YN-37J5]. For a legal account, see, for example, Bebchuk & Spamann, supra note 13, at 257–58 and Sanjai Bhagat & Roberta Romano, Essay, Reforming Executive Compensation: Focusing and Committing to the Long-Term, 26 Yale J. Reg. 359, 363 (2009). ↑ - .E.g., Tirole, supra note 20, at 23–24. ↑
- .See supra notes 55–60 and accompanying text. ↑
- .Cremers & Sepe, supra note 16, at 73 & n.30, 114–15. ↑
- .Under Rule 14a-8 of the Securities Exchange Act of 1934, 15 U.S.C. §§ 78a–78pp (2012), a public company is required to include a shareholder proposal (and related supporting statements) in its proxy statement and allow shareholders to vote on the proposal unless either the shareholders have not complied with eligibility or procedural requirements or some other named exception applies. See 17 C.F.R. § 240.14a-8 (2016). ↑
- .The theoretical underpinning here is the semi-strong form of the Efficient Capital Market Hypothesis (ECMH), under which market prices accurately reflect all available public information on firm outcomes. See Eugene F. Fama, Efficient Capital Markets: A Review of Theory and Empirical Work, 25 J. Fin. 383, 383 (1970). ↑
- .Market prices are especially likely to be uninformative in the case of firm-specific investments—such as investments in innovation or other intangible assets—as information about the fundamental value of these investments tends to be “soft,” that is, nonverifiable by outsiders even if insiders share their views with them. Tirole, supra note 20, at 249–50. At the same time, channeling resources to such investments tends to require large capital expenditures up front and, hence, to decrease earnings in the short term. This decrease in present earnings is a type of “hard” information, so that decreased earnings will tend to lead to lower short-term stock prices. E.g., Alex Edmans et al., The Real Costs of Financial Efficiency when Some Information Is Soft, 20 Rev. Fin. 2151, 2152–53, 2158 (2016). As a result, shareholders may take the fall in short-term stock prices following the undertaking of a profitable long-term project to signal managerial underperformance and rationally, although mistakenly, decide to remove the manager. ↑
- .As explained by one of us in a prior article, a board that is protected from short-term market pressure will be more likely to exhibit a bias toward tolerating the occurrence of disappointing firm outcomes and, hence, retaining an apparently underperforming manager. See Simone M. Sepe, Board and Shareholder Power, Revisited, 101 Minn. L. Rev. 1377, 1420 (2017). ↑
- .Murphy, supra note 3, at 330. ↑
- .The ExecuComp database provides information on the five highest paid top executives for firms included in the S&P 1500 composite index. The first year ExecuComp included a complete set of data was 1993. ↑
- . As specified above, CEO-pay packages include many more components. See supra note 40. Over time, however, ExecuComp has changed the way in which it accounts for many of these components. Because of this limitation, we only consider the pay components that exhibit consistent reporting in ExecuComp across the years. ↑
- .Both PPS and PVS are aggregated across a CEO’s most recent and all previous years’ pay packages, but only considering those stocks and options that the CEO currently still owns. ↑
- .By definition, PPS does not capture the variability of fixed compensation, as fixed-pay components are not tied to changes in shareholder wealth. ↑
- .In the literature, this is a rather standard, although by no means exclusive, way of measuring pay-for-performance sensitivity. See Murphy, supra note 3, at 234–37. ↑
- .While the ultimate source of the data for PPS and PVS is ExecuComp, we use the PPS and PVS data as used in previously published work by Jeffrey Coles et al., which they made publicly available with a sample extended to 2014. See generally Jeffrey L. Coles et al., Co-Opted Boards, 27 Rev. Fin. Stud. 1751 (2014). ↑
- .See Bebchuk & Fried, supra note 7, at 80, 82–83 (arguing that CEOs can be expected to have more power, and hence an easier time capturing boards, in companies with fewer institutional investors). ↑
- .See Gabaix & Landier, supra note 71, at 50 (“The sixfold increase in CEO pay between 1980 and 2003 can be attributed to the sixfold increase in market capitalization of large U.S. companies during that period.”). ↑
- .Although our focus is on the S&P 1500, we still consider the S&P 500 for consistency with the work of Gabaix and Landier, which has come to constitute a reference in the empirical literature. However, while Gabaix and Landier use the asset market cap of the reference firm, we use the equity market cap, consistent with the prior work of one of us on managerial talent competition. See Cremers & Grinstein, supra note 85, at 932. ↑
- .See Gabaix & Landier, supra note 71, at 49–51. ↑
- . We acknowledge that our measure of product competition is imperfect as it is actually a measure of market concentration. Indeed, there could be concentrated industries that are also competitive. In general, however, more concentrated industries will be less likely to be competitive (and vice versa), which makes our measure a plausible proxy for competition. ↑
- .See Cremers & Grinstein, supra note 85, at 932, 937. Since Product Competition is at industry level, it arguably has the advantage of not being (fully) under the firm’s control, which mitigates endogeneity concerns. We also acknowledge that our measure of product competition is imperfect as it is actually a measure of market concentration. Then, it could be possible that there are concentrated industries which are competitive. However, it is more likely that more concentrated industries are less competitive and vice versa. For this reason, our measure is a plausible proxy for product competition. Note that product-market competition does not exclude labor-market competition. ↑
- .We adapt this measure from the prior work of one of us with Allen Ferrell. See Martijn Cremers & Allen Ferrell, Thirty Years of Shareholder Rights and Firm Value, 69 J. Fin. 1167, 1172 (2014) (introducing a new dataset on shareholder governance rights, spanning from 1978 to 2006). Like Product Competition, Market Competition is at industry level, and, therefore, we can assume plausible exogeneity at the firm level. ↑
- .See id. at 1190–92 (suggesting that “the association between shareholder rights and firm value arises primarily through a ‘takeover channel,’ that is, through affecting the probability of an offer being received and accepted”). ↑
- .We emphasize that we reduce the importance of outliers in the data by consistently winsorizing each continuous variable at the 1% level on both sides of the distribution. ↑
- .In order to be able to compare compensation levels across years, the monetary amount for each year is converted to thousands of 2015-constant U.S. dollars using the Consumer Price Index deflator. ↑
- .See I.R.C. § 162(m) (2012) (excluding “performance-based compensation” from the $1 million deductibility cap). ↑
- .Murphy, supra note 3, at 277–79. ↑
- .Id. at 298; see also David I. Walker, Evolving Executive Equity Compensation and the Limits of Optimal Contracting, 64 Vand. L. Rev. 611, 632–39 (2011) (discussing several possible causes of the decline in option compensation and the increase in stock compensation in recent times, including “a return to normalcy” following the dot-com crash of 2000–2002). ↑
- .Murphy, supra note 3, at 297. ↑
- .David Aboody et al., Firms’ Voluntary Recognition of Stock-Based Compensation Expense, 42 J. Acct. Res. 123, 124 (2004). ↑
- . The changes in the accounting treatment of options have had a long story. In 1993, FASB proposed rules that would have required the value of stock options to be treated as compensation expenses on the income statement. In particular, the original FAS123 encouraged corporations to treat stock options as an expense based on their fair value on the date that the company granted the options. Corporations, however, could continue to use the previous intrinsic value method as long as they supplied additional disclosures about the options’ fair value in the notes to the financial statements, which most of them continued to do until the corporate scandals of the 2000s. It was only in December 2004 that FASB issued FAS123(R), which mandated expensing. The Exposure Draft proposed application to new awards or modified awards in fiscal years beginning after December 15, 2004, but the final pronouncement postponed the effective date for large public entities to awards after the start of the first interim or annual reporting period that began after June 15, 2005 (meaning July 1, 2005, for calendar-year corporations). See Tor-Erik Bakke et al., The Causal Effect of Option Pay on Corporate Risk Management, 120 J. Fin. Econ. 623, 625 (2016). In the midst of struggling with the demands of Sarbanes-Oxley, especially with respect to internal controls over financial reporting, issuers sought a further delay in the effective date, but FASB refused, even after the SEC joined in the request. The SEC then decided to act on its own, adopting a new rule that gave most large public companies a six-month reprieve. That rule allowed those companies to implement FAS123(R) for new or modified awards in their next fiscal year, that is, after January 1, 2006 (rather than the next reporting period that began after June 15, 2005). See Bakke et al., supra, at 625. ↑
- .See Share-Based Payment, Statement of Fin. Accounting Standards No. 123 (Fin. Accounting Standards Bd. 2004), http://www.fasb.org/cs/BlobServer?blobkey=id&
blobnocache=true&blobwhere=1175823287357&blobheader=application%2Fpdf&blobcol=urldata&blobtable=MungoBlobs [https://perma.cc/NU7H-GVMR]. ↑ - .See id.; Murphy, supra note 3, at 297–98. ↑
- .Murphy, supra note 3, at 298. ↑
- .See supra text accompanying notes 55–60. ↑
- .See supra text accompanying notes 115–18. ↑
- .See supra notes 82–84 and accompanying text. ↑
- .See, e.g., Rüdiger Fahlenbrach, Shareholder Rights, Boards, and CEO Compensation, 13 Rev. Fin. 81 (2009) (similarly documenting empirical evidence inconsistent with managerial power theory). Fahlenbrach employs governance indices to measure the relative strength of shareholder and manager rights, including the E-Index. See supra note 55 for an explanation of the E-Index. However, he only performs a cross-sectional analysis, rather than a time-series analysis with firm fixed effects. See infra note 152 for a comparison of these two analyses. This is probably due to very limited time-series variation in the governance indices over the time period he considers, i.e., 1993–2004. ↑
- .Unlike a cross-sectional analysis, a time-series analysis controls for any and all firm variables that do not change over time—that is, a firm’s “fixed effects”—for each firm included in a panel dataset, adding a separate dummy variable for each unique firm. See Cremers, Masconale & Sepe, supra note 55, at 752–53 for further explanation. ↑
- .See John C. Coates IV, Takeover Defenses in the Shadow of the Pill: A Critique of the Scientific Evidence, 79 Texas L. Rev. 271, 288 (2000) (describing how a “shadow pill,” a pill that could be adopted but has not yet been, may be as effective in impeding takeovers as a pill that has been adopted and commenting that “adoption of an actual pill by any given firm only brings this shadow pill into the light”). ↑
- .See supra text accompanying notes 65–69. ↑
- .As the reference firm in Talent Competition is identified each year, we cannot use year fixed effects. Therefore, in order to control for inflation, we deflate CEO Pay, Assets, and Market Cap into 2015-constant dollars, using the GDP deflator from the Bureau of Economic Analysis. ↑
- .See supra subpart III(A). ↑
- . We control this result for the market capitalization of the firm’s equity (Market Cap), as well as the book value of the firm’s total assets (Assets), so that the direct effects of firm size—that larger firms pay their CEOs more, and that firms where market capitalization or assets have gone up increase their CEO pay—are likewise controlled for. ↑
- .This is equal to 0.417. See infra Appendix Table C. ↑
- . This is calculated by multiplying a standard deviation increase in Talent Competition, 0.417, by the coefficient on Talent Competition of 0.34. ↑
- . When we control the specification of Table 2, Column 1 for Staggered Board, the stand-alone impact of Staggered Board on CEO Pay is negative and statistically significant. However, the impact of Talent Competition on CEO Pay conditional on the presence of a staggered board is positive and statistically significant. This means that while in general a staggered board helps control CEO Pay, when Talent Competition increases, a staggered board efficiently reacts to external pressure by readjusting CEO Pay in line with that of firms without a staggered board. ↑
- .This is calculated by multiplying a standard deviation increase in Talent Competition, 0.417, by the coefficient on Talent Competition of 0.34. ↑
- .See supra subpart II(C). ↑
- .See supra text accompanying notes 65–69. ↑
- .See supra notes 144–47. ↑
- .All specifications include firm fixed effects such that we are effectively estimating how changes in firm value are associated with changes in the level of competition and the use of takeover defenses in the time series. Since our corporate governance focus is on Staggered Board and Poison Pill, and given space constraints, in Table 3 we do not run regression for Institutional Ownership. If we include Institutional Ownership as a control, however, our results remain unchanged. ↑
- .See supra note 24. ↑
- . The percentage effect is calculated as the coefficient estimate of CEO Pay (0.100), multiplied by the standard deviation (0.998) of CEO Pay, and then dividing the product by the median Tobin’s Q in the sample (1.524, see infra Appendix Table C). ↑
- .See supra subpart I(B). ↑
- .See supra subpart I(C). ↑
- .See supra section II(B)(2). ↑
- .Note that in Table 3, we do not disentangle the stock and option components of equity-based compensation, as this analysis is at the core of our event study in subpart IV(B) below. ↑
- .See supra notes 114–15 and accompanying text. ↑
- .The stand-alone coefficient on Staggered Board is also positive and statistically significant, in line with the results obtained in recent research on staggered boards. See Cremers & Sepe, supra note 16, at 100–05 and Cremers, Litov & Sepe, supra note 16 (manuscript at 12–13) for more detailed discussions. ↑
- .See supra Table 1. ↑
- .See supra subpart II(C). ↑
- .See id. ↑
- .See, e.g., Alex Edmans et al., The Real Effects of Financial Markets: The Impact of Prices on Takeovers, 67 J. Fin. 933, 934 (2012) (“[A]n anticipation effect may lead to reverse causality from takeover activity to market valuations, with forward-looking prices inflated by the probability of a future takeover.”). ↑
- .Lastly, for robustness, Column 7 verifies the impact on firm value of each of our corporate governance, competition, and compensation proxies while simultaneously controlling for the other proxies, confirming the results described in subpart IV(A). ↑
- .See William H. Greene, Econometric Analysis 56–58 (7th ed. 2012) (discussing the two most common specification errors: the omission of relevant variables and the inclusion of irrelevant variables). ↑
- .See Mitchell H. Katz, Study Design and Statistical Analysis 25 (reprt. 2009) (defining “reverse causality” as when “the ‘effect’ causes the ‘cause’”). ↑
- .One could argue that since we do not present a theory of pay determination under managerial power theory, we cannot exclude the possibility that managers extract higher rents when firm value is high. This is why we consider a quasi-natural experiment in this subpart—in order to get some plausibly exogenous variation in executive compensation that is unlikely to be driven by such reverse causality. See infra section IV(B)(2). ↑
- .A prior study by Tor-Erik Bakke et al. employed FAS123(R) as a quasi-natural experiment to study how CEOs’ option compensation affects the hedging behavior of energy firms. Tor-Erik Bakke et al., The Causal Effect of Option Pay on Corporate Risk Management, 120 J. Fin. Econ. 623, 624 (2016). The basic design of our empirical methodology closely follows the empirical design by Bakke et al. See id. at 626–29. However, to the best of our knowledge, we are the first to employ the option-expensing mandate as a quasi-natural experiment to study the association between firm performance and executive compensation. ↑
- .While we recognize that shareholders may learn about future cash flows from current accounting performance, the direct effect of expensing stock options seems easily identifiable. ↑
- . One could argue that some firms only adopted FAS123(R) after Jan. 1, 2006. See supra note 144. What matters for our analysis, however, is the comparison between firms that were affected by FAS123(R) because they had outstanding options and firms that were not affected by it because they did not have outstanding options. Even if our sample of treated firms may not include all the firms that were affected by FAS123(R) (because some firms only adhered to the mandate in 2006), this does not affect our ability to compare treated firms and control firms. ↑
- .See supra subpart III(B). ↑
- . Nevertheless, one could argue that the changes induced by the new rule all flow from the reduced use of options, so that it would not be possible to disentangle the effects of reduced CEO pay and the reduced use of options because those reductions coincide in the data. Yet, if compensation levels (and not just Option Portion, which is a percentage measure) before the new rule were excessive in the sense defended by managerial power scholars, should we not observe a mechanical effect on firm value (i.e., an increase in value) after the new rule? Conversely, CEO Pay Treated 2005–2006 does not have a negative association with firm value. ↑
- .This percentage is calculated by multiplying the coefficient on Equity Portion Treated 2005–2006, –0.302, by the standard deviation of Equity Portion (2.777) and then dividing the product by the average Q in the sample, 1.89 (see Appendix Table C). ↑
- .The double interaction Equity Portion Treated (shown in Column 2) has a small negative and insignificant coefficient of –0.0977 (t-statistic of 0.45). Therefore, the reductions in equity-based pay following the introduction of FAS123(R) were not associated with changes in performance in the two years before the rule change—when such reductions would have been more likely to be due to firm-specific circumstances rather than the upcoming rule change. Instead, we observe such association only in the two years after the rule change. Therefore, we document a discontinuity in the association between Equity Portion and firm value. This suggests that changes in the proportion of equity-based pay before versus after the rule change were caused by different factors, consistent with a causal interpretation of our event study. ↑
- .This percentage is calculated by multiplying the coefficient on Option Portion Treated 2005–2006, –0.357, by the standard deviation of Option Portion divided by the average Q in the sample, 1.89 (see Appendix Table C). ↑
- .A possible concern with our specification could be that firms in our control group may not be perfectly comparable to the treated firms affected by the accounting rule change. For example, our control firms could be in different industries than our treated firms. More generally, as options are more likely to be used in certain industries than others, it is possible that industry-level shocks could partly explain our performance results. In order to mitigate this concern, we run the following robustness check. For each of the specifications in Panel B of Table 4, we add time-varying industry fixed effects by interacting two-digit SIC industry groups with year fixed effects. This adds about 200 more dummies to each specification. Our results are robust to the addition of such higher-order fixed effects. More specifically, once we control for higher-order fixed effects, the interacting variable Equity Portion Treated 2005–2006 in Column 2 of Panel B of Table 4 has a coefficient of –0.271 (with a t-statistic of 2.74), and the interacting variable Option Portion Treated 2005–2006 in Column 3 has a coefficient of –0.324 (with a t-statistic of 2.95). These results are very similar in terms of statistical and economic significance to those appearing in Panel B of Table 4. ↑
- .Figure 2 documents that over 2003–2006, firms generally were increasing their proportions of stock-based pay. Consistently, the results in Panel A of Table 4 show that control firms were on average increasing their use of stock-based pay in 2005 and 2006 as much as the treated firms. Therefore, the overall trend in Figure 2 masks an important diversion in 2005 and 2006 between firms affected and unaffected by the introduction of FAS123(R): both groups of firms increased their use of stock-based pay, but only the firms affected by the accounting rule change substantially lowered their overall use of equity-based pay, on average. ↑
- .It is worth emphasizing here that M&A Competition is a measure at industry level; therefore, it substantially reduces endogeneity concerns. ↑
- .See supra notes 87–88 and accompanying text. ↑
- .Bebchuk & Fried, supra note 7, at 11. ↑
- .See id. at 207–13. ↑
- .See supra subpart I(B). ↑
- .See supra section II(B)(2). ↑
- .See supra text accompanying notes 114–15. ↑
- .See Cremers & Sepe, supra note 16, at 142 (similarly defending the rationality of the traditional board-centric model on economically grounded reasons); Leo E. Strine, Jr., Toward a True Corporate Republic: A Traditionalist Response to Bebchuk’s Solution for Improving Corporate America, 119 Harv. L. Rev. 1759, 1777–82 (2006) (illustrating how a traditionalist would defend the “republican” board-centric model of the corporation against the proposals by shareholder advocates to move to a “direct democracy” model); William W. Bratton & Michael L. Wachter, The Case Against Shareholder Empowerment, 158 U. Pa. L. Rev. 653, 658–60 (2010) (defending the received board-centric model of the corporation based on the board’s informational advantage). ↑
- .See, e.g., Freedman v. Adams, 58 A.3d 414, 417 (Del. 2013) (rejecting a claim for waste alleging that the board had failed to adopt a compensation plan under § 162(m) of the Internal Revenue Code and reaffirming that decisions concerning both the level and structure of executive compensation are protected by the business judgment rule). ↑
- .David F. Larcker et al., The Influence of Proxy Advisory Firm Voting Recommendations on Say-on-Pay Votes and Executive Compensation Decisions, Conf. Board, Mar. 2012, at 1, 1–2, https://www.gsb.stanford.edu/sites/gsb/files/publication-pdf/cgri-survey-2012-proxy-voting_0.pdf [https://perma.cc/PKH2-TDHQ]. This is especially true for Institutional Shareholder Services (ISS), which advises clients that manage over $25 trillion in assets. See Robert D. Hershey, Jr., A Little Industry with a Lot of Sway on Proxy Votes, N.Y. Times (June 18, 2006), http://www.nytimes.com/2006/06/18/business/yourmoney/18proxy.html?mcubz=3 [https://perma.cc/6MW8-893C] (describing ISS as the most prominent advisory firm). Further, ISS also offers consulting services on executive-compensation programs, which are designed to increase a firm’s likelihood of receiving a favorable say-on-pay vote. Larcker et al., supra, at 2. ↑
- .Larcker et al., supra note 201, at 1–2. ↑
- .See Martijn Cremers, Saura Masconale & Simone M. Sepe, Activist Hedge Funds and the Corporation, 94 Wash. U. L. Rev. 261, 270, 292–94 (2017) (describing the rise of activist hedge funds and providing real-world examples of hedge funds’ governance activism). ↑
- .See Larcker et al., supra note 201, at 2. ↑
- .Id. ↑
- .Anders Melin, ‘Earnings Hysteria’ Pits ISS Against Clinton and Fink on CEO Pay, Bloomberg (Aug. 23, 2016), https://www.bloomberg.com/news/articles/2016-08-23/-earnings-hysteria-pits-iss-against-clinton-and-fink-on-ceo-pay [https://perma.cc/PUX3-9BLV] (reporting a statement by Larry Fink, CEO of BlackRock, the largest asset management firm in the world). ↑
- .See Larcker et al., supra note 201, at 3, 5 (documenting these changes, which, among others, included enhanced disclosure, reduced severance benefits, and the introduction of performance-based equity awards). ↑
- .See supra note 120. ↑
- .See Melin, supra note 206 (reporting a statement by Ira Kay, managing partner at compensation consultant Pay Governance). ↑
- .See Marcel Kahan & Edward Rock, Embattled CEOs, 88 Texas L. Rev. 987, 1013–15, 1017–22 (2010) (providing a thorough discussion of the changes that have occurred in proxy rules in the past ten to twenty years); see also supra note 118 (summarizing Rule 14a-8, which governs shareholder proposals). ↑
- .See, e.g., Del. Code Ann. tit. 8, § 112 (2011) (providing that a company’s bylaws may give shareholders the right to nominate dissident slates of directors); id. § 113(a) (permitting a company’s bylaws to “provide for the reimbursement by the corporation of expenses incurred by a stockholder in soliciting proxies in connection with an election of directors”). ↑
- .See supra note 203. ↑
- .Larcker et al., supra note 201, at 1. ↑
- .Under majority voting, only nominees who receive a majority of the votes cast are elected to the board. As a result, vote-withholding campaigns—involving the withholding of votes on specific governance issues, including the election of directors—have become potent weapons in the arsenal of activist shareholders, since shareholders can effectively use this process to throw incumbents out of office without having to file a proxy statement with the SEC. See Leo E. Strine, Jr., Toward Common Sense and Common Ground? Reflections on the Shared Interests of Managers and Labor in a More Rational System of Corporate Governance, 33 J. Corp. L. 1, 11–12 (2007). ↑
- .Kahan & Rock, supra note 210, at 1038. ↑
- .Charter amendments can only be initiated by the board and require shareholder approval. See, e.g., Del. Code Ann. tit. 8, § 242(b) (2011); Model Bus. Corp. Act § 10.03 (Am. Bar Ass’n 2010). When the staggered board is established in the bylaws, instead, shareholders can unilaterally dismiss it, as board initiative is not required for bylaw amendments. See, e.g., Del. Code Ann. tit. 8, § 109(a); Model Bus. Corp. Act § 10.20. ↑
- .See Cremers & Sepe, supra note 16, at 98–99 (documenting that the decline in staggered boards over time is largely due to increased destaggering rather than a fall in staggering events). ↑
- .The recommendation that companies should have a unitary board, or else shareholders should seek a destaggering proposal, figures among the most important voting guidelines that proxy advisors routinely provide to investors. See, e.g., Institutional S’holder Servs., 2014 U.S. Proxy Voting Summary Guidelines 10, 17 (2013), https://www.issgovernance.com/
file/files/2014ISSUSSummaryGuidelines.pdf [https://perma.cc/3E5U-LML3]. ↑ - .See, e.g., Cremers & Sepe, supra note 16, at 92 (discussing the intense destaggering activity of the Harvard Shareholder Rights Project, a clinical program established at Harvard Law School to assist institutional investors in the submission of destaggering proposals). ↑
- .See Cremers, Masconale & Sepe, supra note 55, at 771 (discussing supermajority requirements to amend a firm’s charter or a firm’s provisions for approving mergers); Cremers, Litov & Sepe, supra note 15 (manuscript at 22) (analyzing potential benefits of staggered boards); Sepe, supra note 119, at 1437–38 (suggesting “that a charter provision requiring the approval of a supermajority—two-thirds or more—of the shareholders for the dismissal of defensive tactics would be beneficial”). ↑
- .Sepe, supra note 121, at 1437–39. ↑
- .Id. at 1440–41. ↑
- . The clearest evidence is provided by the 2010 Dodd-Frank Act’s provision directing the SEC to introduce a CEO-pay-ratio disclosure requirement. Dodd-Frank Wall Street Reform and Consumer Protection Act of 2010, Pub. L. No. 111-203, § 953(b), 124 Stat. 1376, 1899 (2010) (codified as amended at 15 U.S.C. § 78n-1). Under this requirement, all U.S. public companies will have to disclose the ratio of CEO pay to median employee pay starting in 2018 proxy statements (reporting on fiscal year 2017). See 17 C.F.R. § 229.402 (Executive Compensation). The theory behind this impeding mandate is that making the CEO pay ratio publicly available will make board capture by executives more difficult—or, at least, more evident to firm outsiders, including shareholders—ultimately leading to a reduction of both CEO pay and income inequality. See Ira Kay & Blaine Martin, CEO Pay Ratio and Income Inequality: Perspectives for Compensation Committees, Harv. L. Sch. F. on Corp. Governance & Fin. Reg. (Oct. 25, 2016), https://corpgov.law.harvard.edu/2016/10/25/ceo-pay-ratio-and-income-inequality-perspectives-for compensation-committees/ [https://perma.cc/9LR7-46CU]. ↑
- . One of the most prominent advocates of this view has been French economist Thomas Piketty. In his book du jour, Capital in the Twenty-First Century, Piketty argues that “supermanagers, that is, top executives of large firms who have managed to obtain extremely high, historically unprecedented compensation packages for their labor,” have come nowadays to make up most of the income hierarchy’s top 0.1%. Thomas Piketty, Capital in the Twenty-First Century 302 (2014). In searching for a rational basis for the explosion in managerial pay, Piketty suggests that one plausible explanation is that “social norms” have allowed senior managers to substantially set their own pay. See id. at 332. ↑